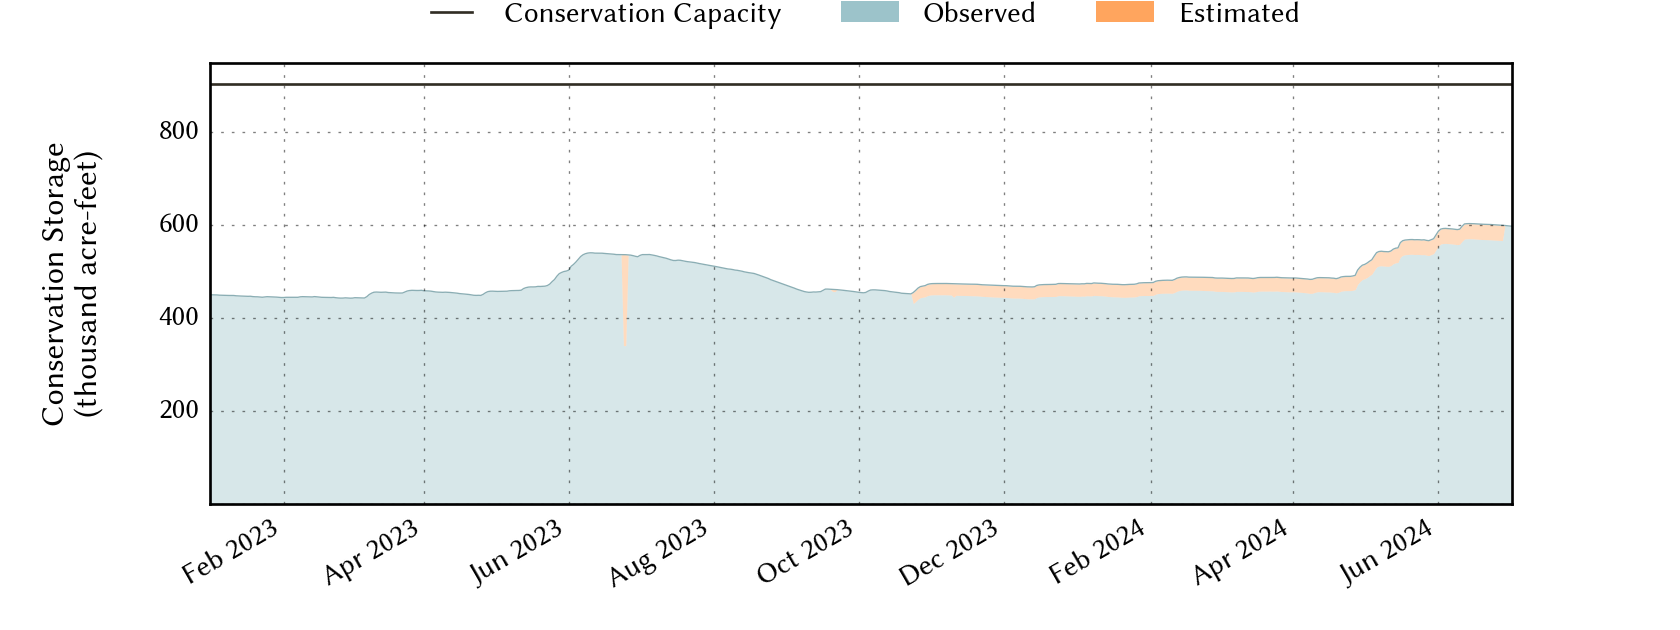
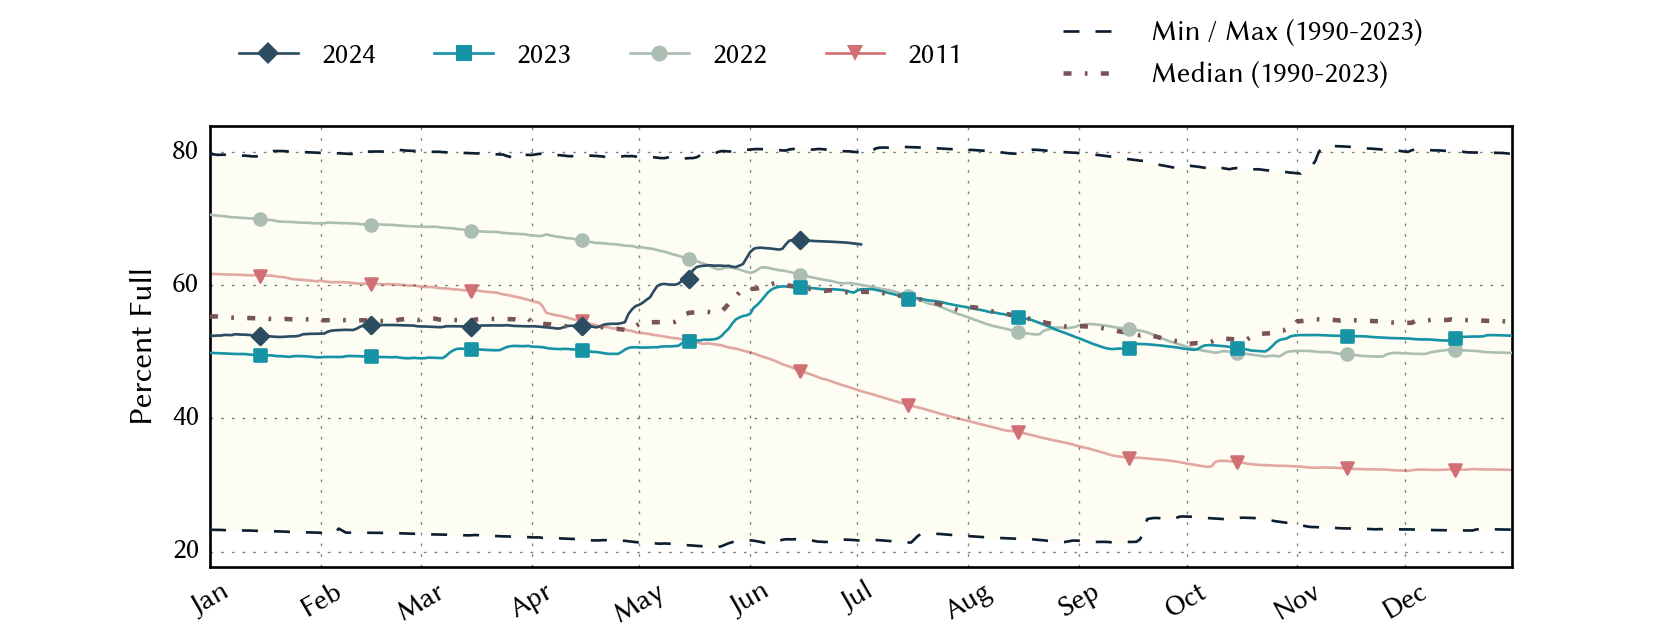
Low-Rolling-Plains Climate Division Reservoirs: Monitored Water Supply Reservoirs are 69.9% full on 2025-02-23
Historical Data
| Date | Percent Full |
Reservoir Storage (acre-ft) |
Conservation Storage (acre-ft) |
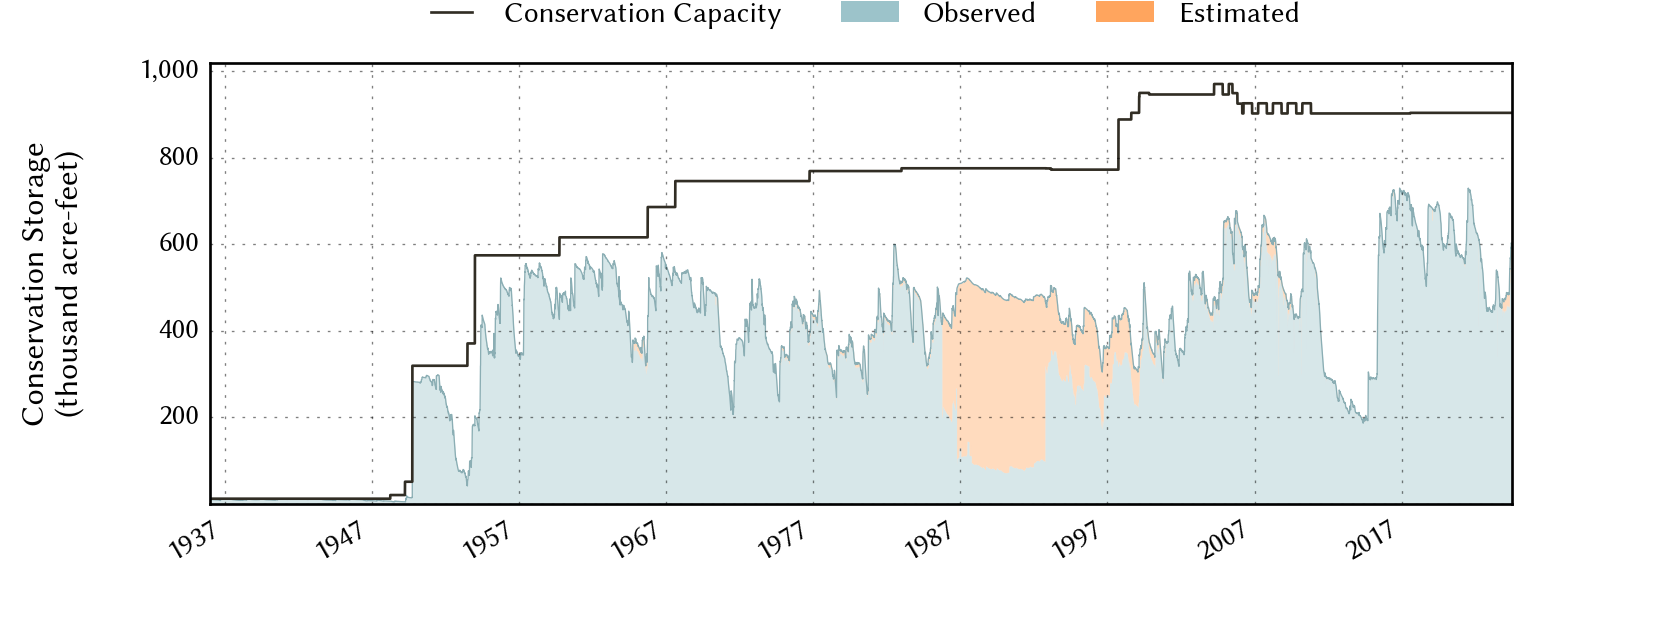
Conservation Capacity (acre-ft) |
|
|---|---|---|---|---|---|
| Today | 2025-02-23 | 69.9 | 640,420 | 632,180 | 903,870 |
| Yesterday | 2025-02-22 | 70.0 | 640,539 | 632,299 | 903,870 |
| 2 days ago | 2025-02-21 | 70.0 | 640,634 | 632,394 | 903,870 |
| 1 week ago | 2025-02-16 | 70.2 | 643,300 | 634,285 | 903,870 |
| 1 month ago | 2025-01-23 | 70.7 | 648,719 | 638,928 | 903,870 |
| 3 months ago | 2024-11-23 | 72.1 | 666,451 | 652,014 | 903,870 |
| 6 months ago | 2024-08-23 | 62.8 | 595,883 | 567,423 | 903,870 |
| 1 year ago | 2024-02-23 | 53.4 | 485,292 | 482,748 | 903,870 |
*
Percent Full is based on Conservation Storage and Conservation Capacity and doesn't account for storage in flood pool.
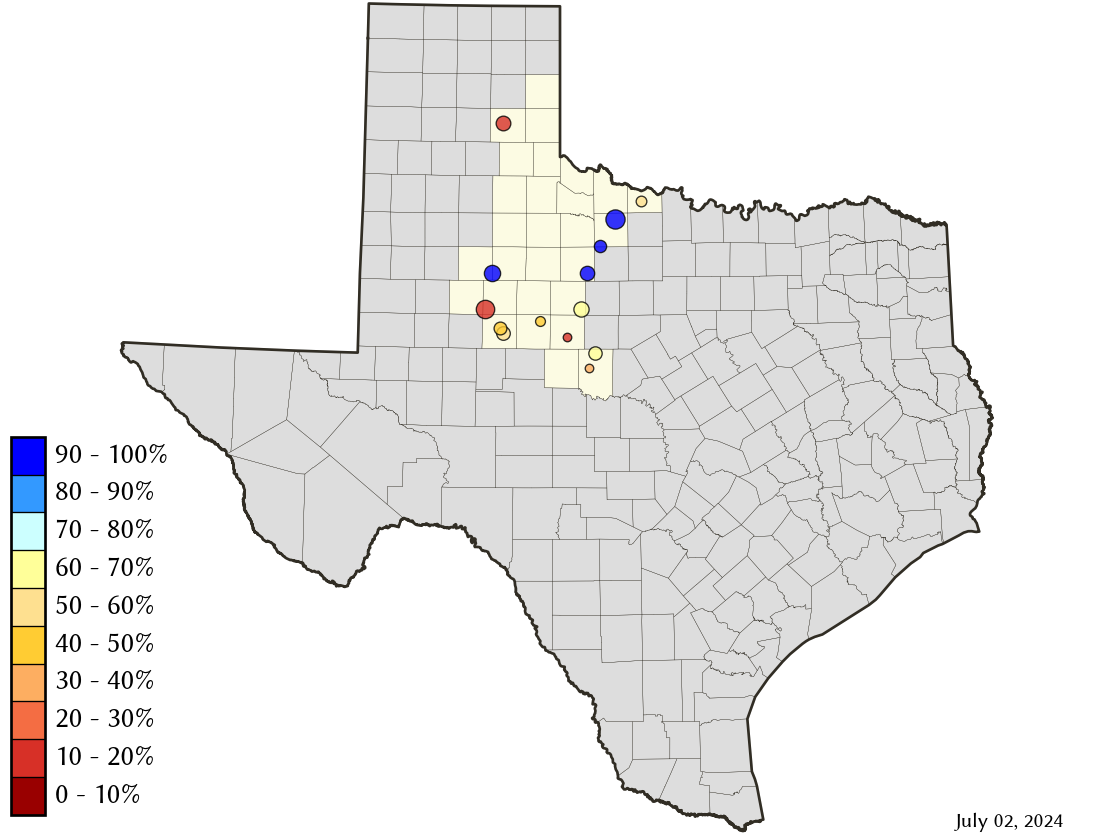
Area Map
Reservoir Storage
| Reservoir | Percent Full |
Water Level (ft) |
Height Above Conservation Pool (ft) |
Reservoir Storage (acre-ft) |
Conservation Storage (acre-ft) |
Conservation Capacity (acre-ft) |
Surface Area (acres) |
|---|---|---|---|---|---|---|---|
| Abilene | 5.1 | 1,989.66 | -22.64 | 399 | 399 | 7,900 | 109 |
| Alan Henry | 97.0 | 2,218.96 | -1.04 | 93,333 | 93,333 | 96,207 | 2,727 |
| Champion Creek | 47.8 | 2,064.98 | -18.02 | 19,893 | 19,893 | 41,580 | 921 |
| Coleman | 97.5 | 1,716.97 | -0.53 | 37,139 | 37,121 | 38,075 | 1,794 |
| Colorado City | 71.8 | 2,063.68 | -6.52 | 22,083 | 22,083 | 30,758 | - n.a. - |
| Fort Phantom Hill | 64.6 | 1,628.56 | -7.34 | 45,245 | 45,239 | 70,030 | 2,926 |
| Greenbelt | 9.1 | 2,614.80 | -49.20 | 5,873 | 5,441 | 59,968 | 406 |
| Hords Creek | 60.2 | 1,892.29 | -7.71 | 4,885 | 4,882 | 8,109 | 338 |
| J B Thomas | 40.4 | 2,237.09 | -20.91 | 81,538 | 80,865 | 199,931 | 4,373 |
| Kemp | 100.0 | 1,144.37 | 0.37 | 251,129 | 245,307 | 245,307 | - n.a. - |
| Millers Creek | 78.9 | 1,331.23 | -2.77 | 22,398 | 21,115 | 26,768 | 1,844 |
| North Fork Buffalo Creek | 37.9 | 1,040.26 | -7.74 | 5,840 | 5,840 | 15,400 | 788 |
| Stamford | 89.9 | 1,415.98 | -0.82 | 46,362 | 46,359 | 51,570 | 4,747 |
| Sweetwater | 35.1 | 2,099.49 | -17.01 | 4,303 | 4,303 | 12,267 | 317 |