San-Antonio River Basin Reservoirs: Monitored Water Supply Reservoirs are 2.4% full on 2025-02-23
Historical Data
| Date | Percent Full |
Reservoir Storage (acre-ft) |
Conservation Storage (acre-ft) |
Conservation Capacity (acre-ft) |
|
|---|---|---|---|---|---|
| Today | 2025-02-23 | 2.4 | 6,156 | 6,156 | 254,823 |
| Yesterday | 2025-02-22 | 2.4 | 6,161 | 6,161 | 254,823 |
| 2 days ago | 2025-02-21 | 2.4 | 6,167 | 6,167 | 254,823 |
| 1 week ago | 2025-02-16 | 2.5 | 6,265 | 6,265 | 254,823 |
| 1 month ago | 2025-01-23 | 2.5 | 6,456 | 6,456 | 254,823 |
| 3 months ago | 2024-11-23 | 2.9 | 7,311 | 7,311 | 254,823 |
| 6 months ago | 2024-08-23 | 3.4 | 8,603 | 8,603 | 254,823 |
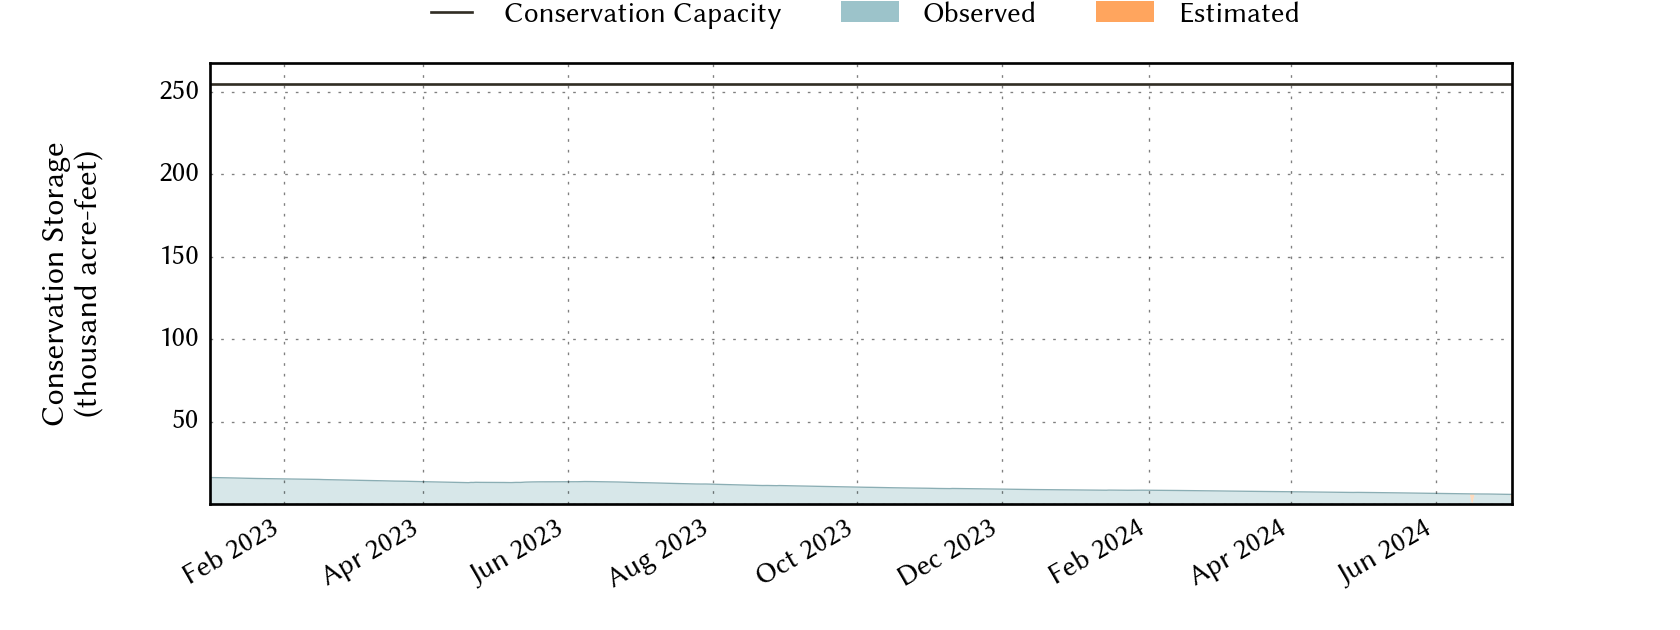
| 1 year ago | 2024-02-23 | 3.2 | 8,055 | 8,055 | 254,823 |
*
Percent Full is based on Conservation Storage and Conservation Capacity and doesn't account for storage in flood pool.
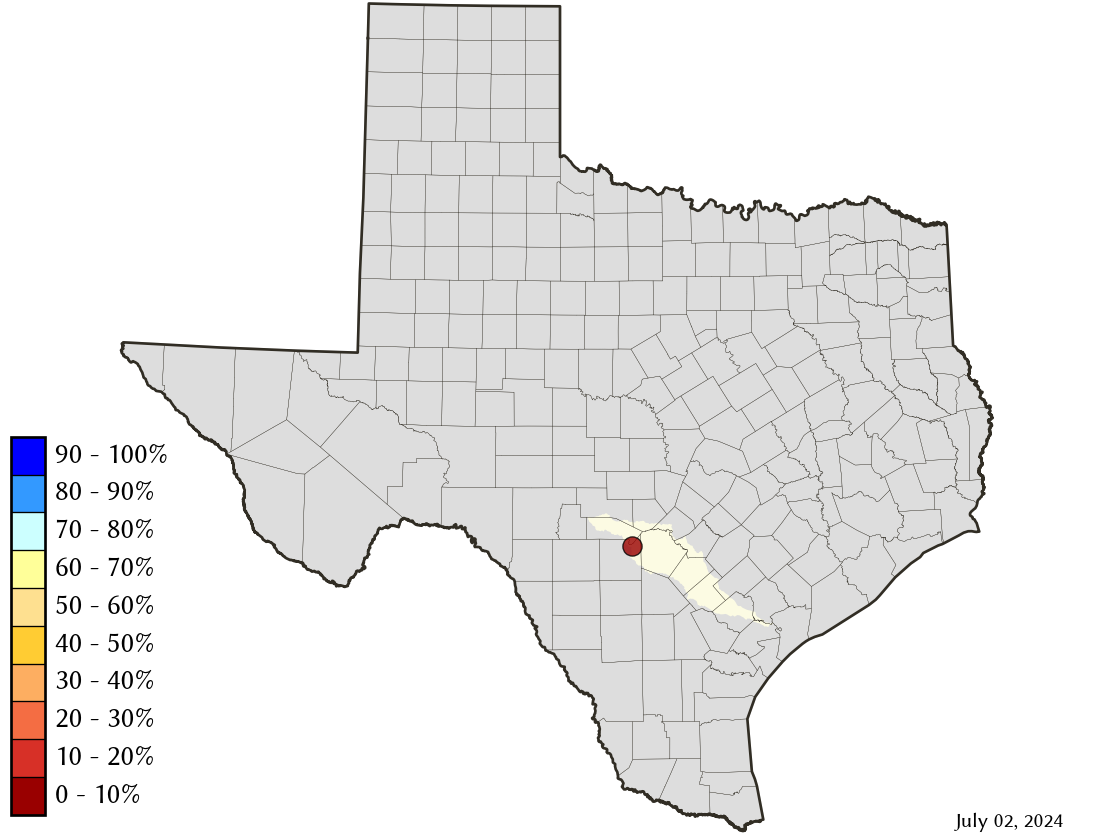
Area Map
Reservoir Storage
| Reservoir | Percent Full |
Water Level (ft) |
Height Above Conservation Pool (ft) |
Reservoir Storage (acre-ft) |
Conservation Storage (acre-ft) |
Conservation Capacity (acre-ft) |
Surface Area (acres) |
|---|---|---|---|---|---|---|---|
| Medina | 2.4 | 971.10 | -93.10 | 6,156 | 6,156 | 254,823 | 571 |