Dallas Area Reservoirs: Monitored Water Supply Reservoirs are 98.3% full on 2025-02-23
Historical Data
| Date | Percent Full |
Reservoir Storage (acre-ft) |
Conservation Storage (acre-ft) |
Conservation Capacity (acre-ft) |
|
|---|---|---|---|---|---|
| Today | 2025-02-23 | 98.3 | 3,873,694 | 3,774,488 | 3,840,521 |
| Yesterday | 2025-02-22 | 98.3 | 3,876,337 | 3,775,801 | 3,840,521 |
| 2 days ago | 2025-02-21 | 98.4 | 3,880,460 | 3,777,869 | 3,840,521 |
| 1 week ago | 2025-02-16 | 98.6 | 3,922,948 | 3,788,259 | 3,840,521 |
| 1 month ago | 2025-01-23 | 93.1 | 3,644,226 | 3,573,937 | 3,840,521 |
| 3 months ago | 2024-11-23 | 89.6 | 3,512,787 | 3,442,498 | 3,840,521 |
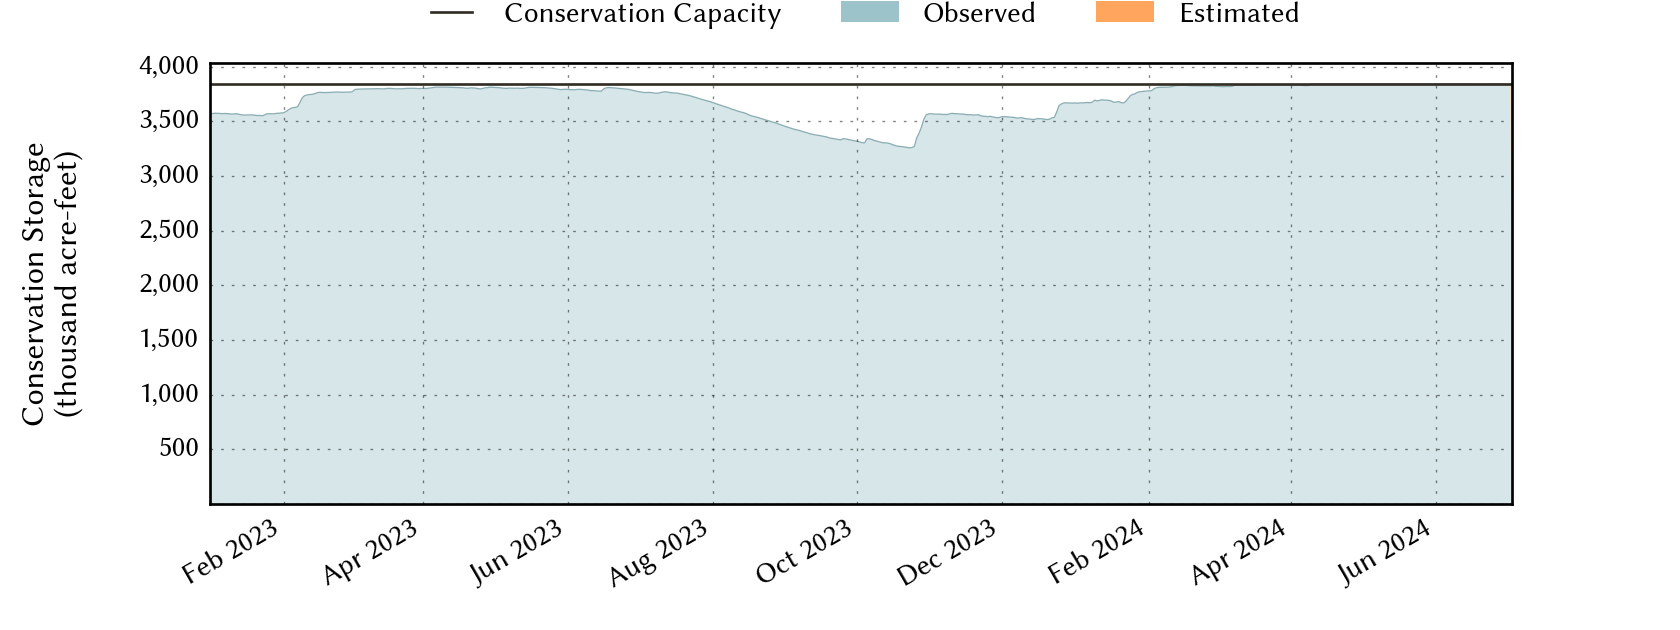
| 6 months ago | 2024-08-23 | 97.0 | 3,794,137 | 3,723,848 | 3,840,521 |
| 1 year ago | 2024-02-23 | 99.6 | 3,922,893 | 3,823,942 | 3,840,521 |
*
Percent Full is based on Conservation Storage and Conservation Capacity and doesn't account for storage in flood pool.
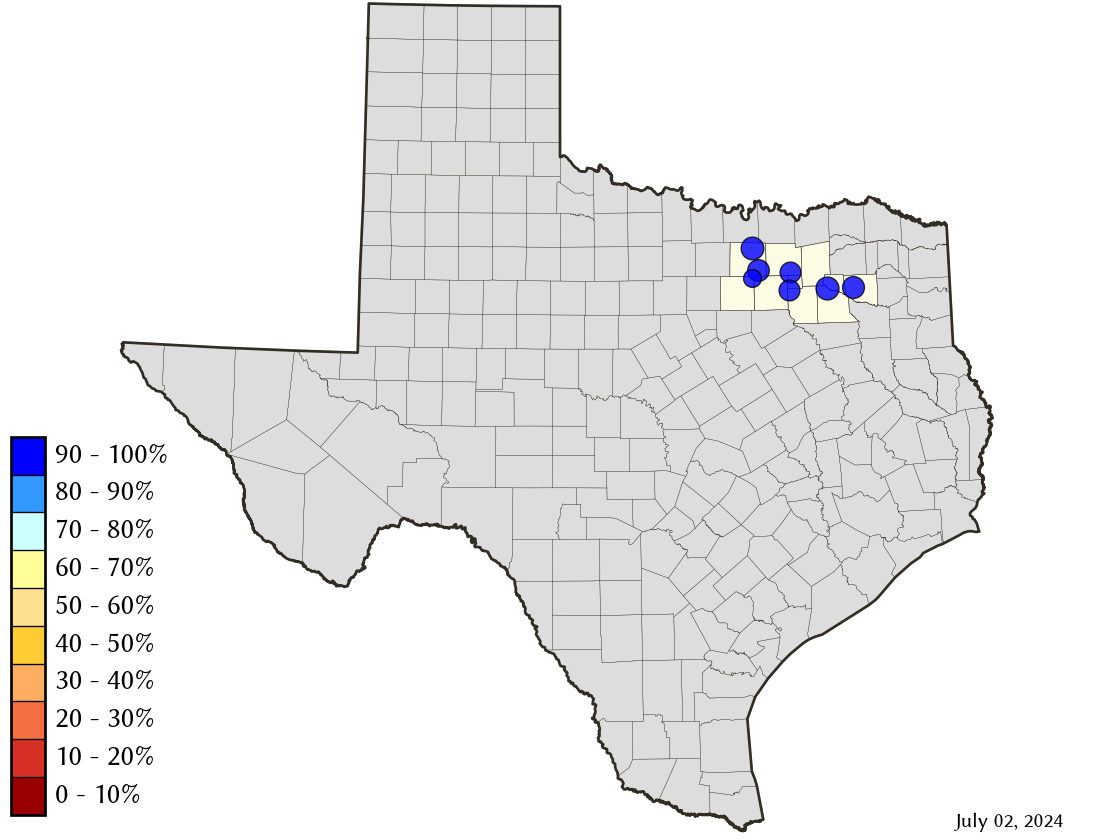
Area Map
Reservoir Storage
| Reservoir | Percent Full |
Water Level (ft) |
Height Above Conservation Pool (ft) |
Reservoir Storage (acre-ft) |
Conservation Storage (acre-ft) |
Conservation Capacity (acre-ft) |
Surface Area (acres) |
|---|---|---|---|---|---|---|---|
| Fork | 99.0 | 402.78 | -0.22 | 630,695 | 599,252 | 605,061 | 26,269 |
| Grapevine | 100.0 | 535.71 | 0.71 | 167,809 | 163,064 | 163,064 | - n.a. - |
| Lavon | 100.0 | 492.25 | 0.25 | 417,774 | 409,757 | 409,757 | 20,824 |
| Lewisville | 92.9 | 520.50 | -1.50 | 559,139 | 523,465 | 563,228 | 26,045 |
| Ray Hubbard | 100.0 | 435.49 | -0.01 | 439,350 | 439,350 | 439,559 | 20,935 |
| Ray Roberts | 97.4 | 631.78 | -0.72 | 768,238 | 767,915 | 788,167 | 27,895 |
| Tawakoni | 100.0 | 438.01 | 0.51 | 890,689 | 871,685 | 871,685 | - n.a. - |