Fort Worth Area Reservoirs: Monitored Water Supply Reservoirs are 93.6% full on 2025-02-23
Historical Data
| Date | Percent Full |
Reservoir Storage (acre-ft) |
Conservation Storage (acre-ft) |
Conservation Capacity (acre-ft) |
|
|---|---|---|---|---|---|
| Today | 2025-02-23 | 93.6 | 2,330,683 | 2,293,498 | 2,451,597 |
| Yesterday | 2025-02-22 | 93.6 | 2,331,213 | 2,294,028 | 2,451,597 |
| 2 days ago | 2025-02-21 | 93.6 | 2,332,007 | 2,294,822 | 2,451,597 |
| 1 week ago | 2025-02-16 | 93.8 | 2,348,151 | 2,299,323 | 2,451,597 |
| 1 month ago | 2025-01-23 | 86.8 | 2,162,475 | 2,127,485 | 2,451,597 |
| 3 months ago | 2024-11-23 | 85.4 | 2,129,653 | 2,094,663 | 2,451,597 |
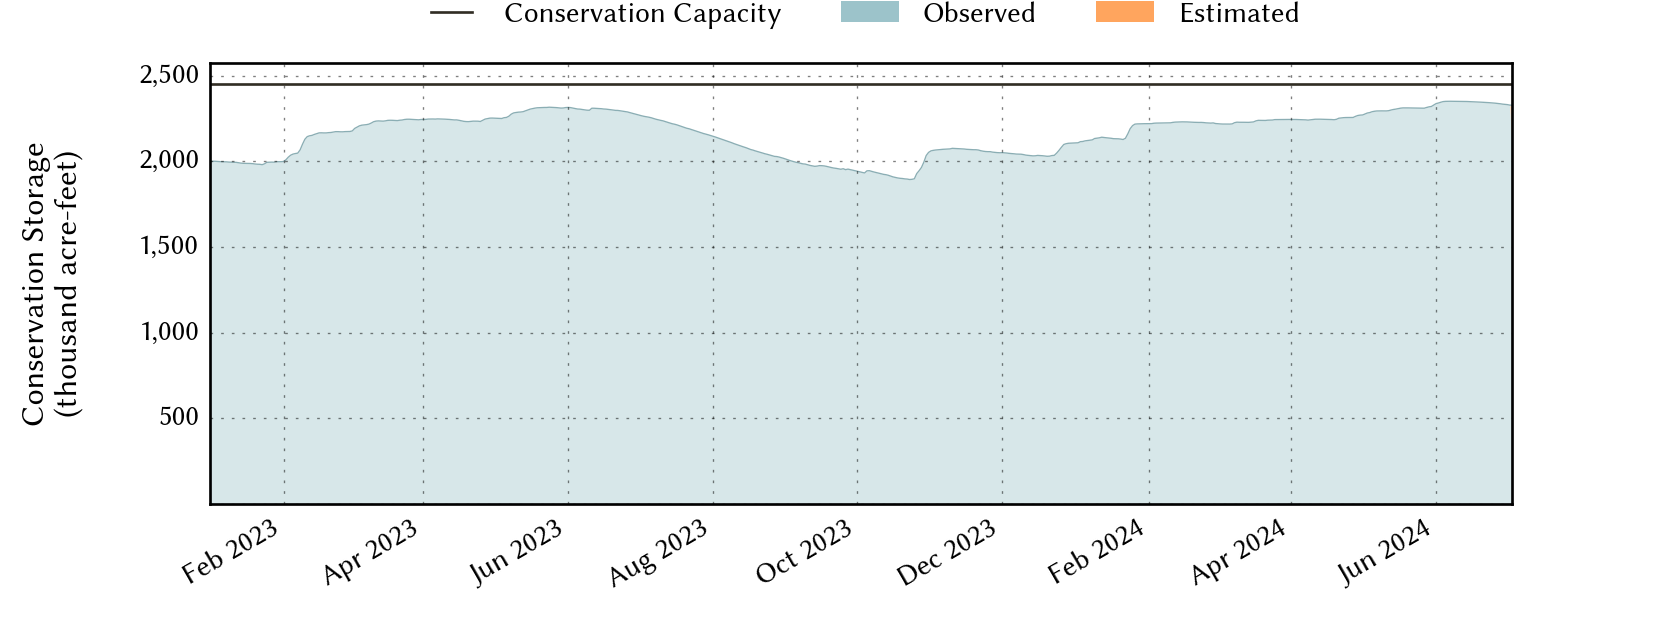
| 6 months ago | 2024-08-23 | 90.6 | 2,257,011 | 2,222,021 | 2,451,597 |
| 1 year ago | 2024-02-23 | 90.9 | 2,267,565 | 2,227,384 | 2,451,597 |
*
Percent Full is based on Conservation Storage and Conservation Capacity and doesn't account for storage in flood pool.
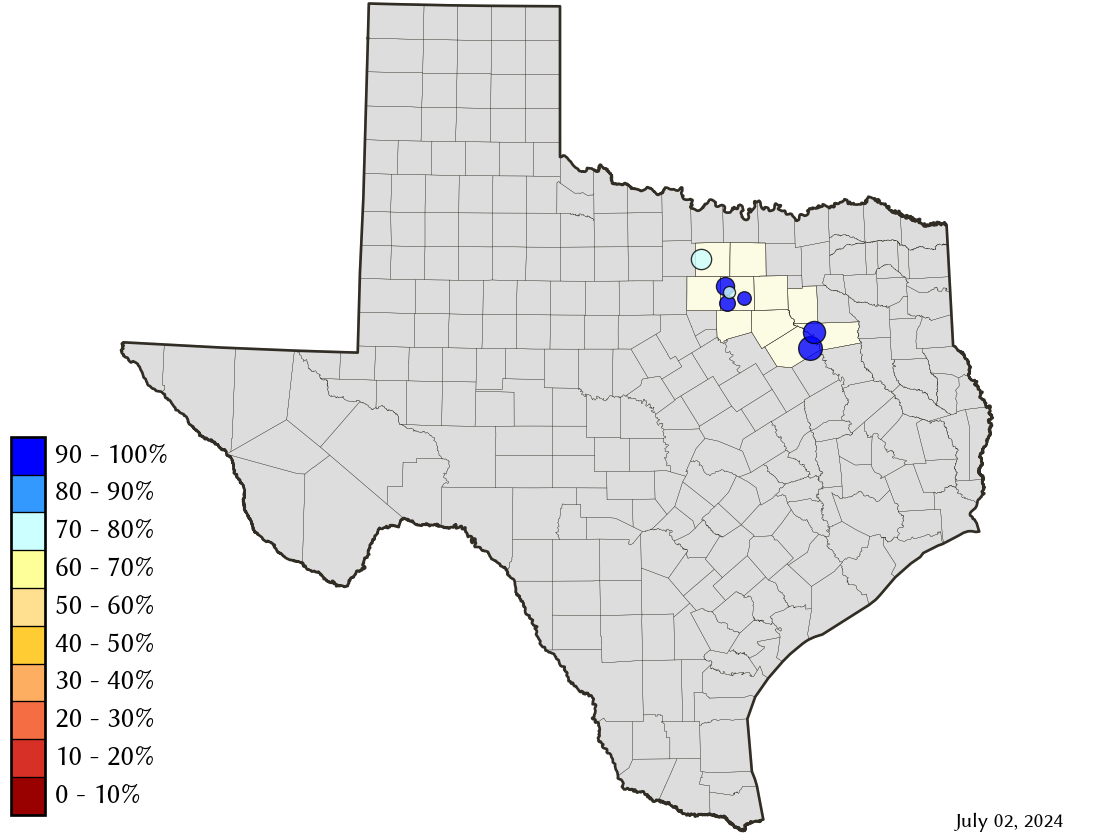
Area Map
Reservoir Storage
| Reservoir | Percent Full |
Water Level (ft) |
Height Above Conservation Pool (ft) |
Reservoir Storage (acre-ft) |
Conservation Storage (acre-ft) |
Conservation Capacity (acre-ft) |
Surface Area (acres) |
|---|---|---|---|---|---|---|---|
| Arlington | 99.5 | 549.90 | -0.10 | 39,996 | 39,964 | 40,157 | 1,921 |
| Benbrook | 93.2 | 692.38 | -1.62 | 79,849 | 79,849 | 85,648 | 3,496 |
| Bridgeport | 72.6 | 826.93 | -9.07 | 270,044 | 270,044 | 372,183 | 10,207 |
| Cedar Creek | 99.4 | 321.88 | -0.12 | 640,864 | 640,765 | 644,686 | 32,589 |
| Eagle Mountain | 79.6 | 644.70 | -4.40 | 147,355 | 147,355 | 185,087 | 7,994 |
| Richland-Chambers | 100.0 | 315.05 | 0.05 | 1,127,395 | 1,099,417 | 1,099,417 | - n.a. - |
| Worth | 65.9 | 591.46 | -2.54 | 25,180 | 16,104 | 24,419 | 3,098 |