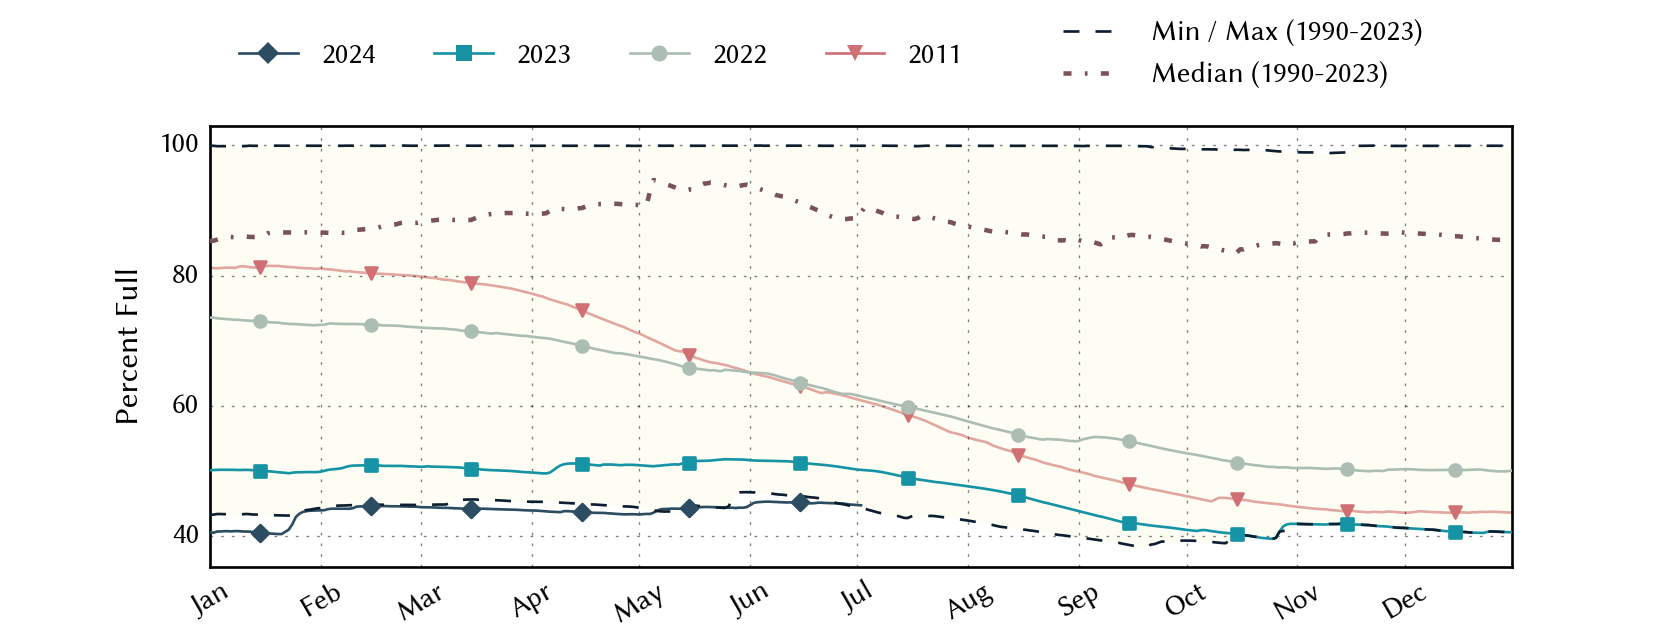
South-Central Climate Division Reservoirs: Monitored Water Supply Reservoirs are 43.7% full on 2025-02-23
Historical Data
| Date | Percent Full |
Reservoir Storage (acre-ft) |
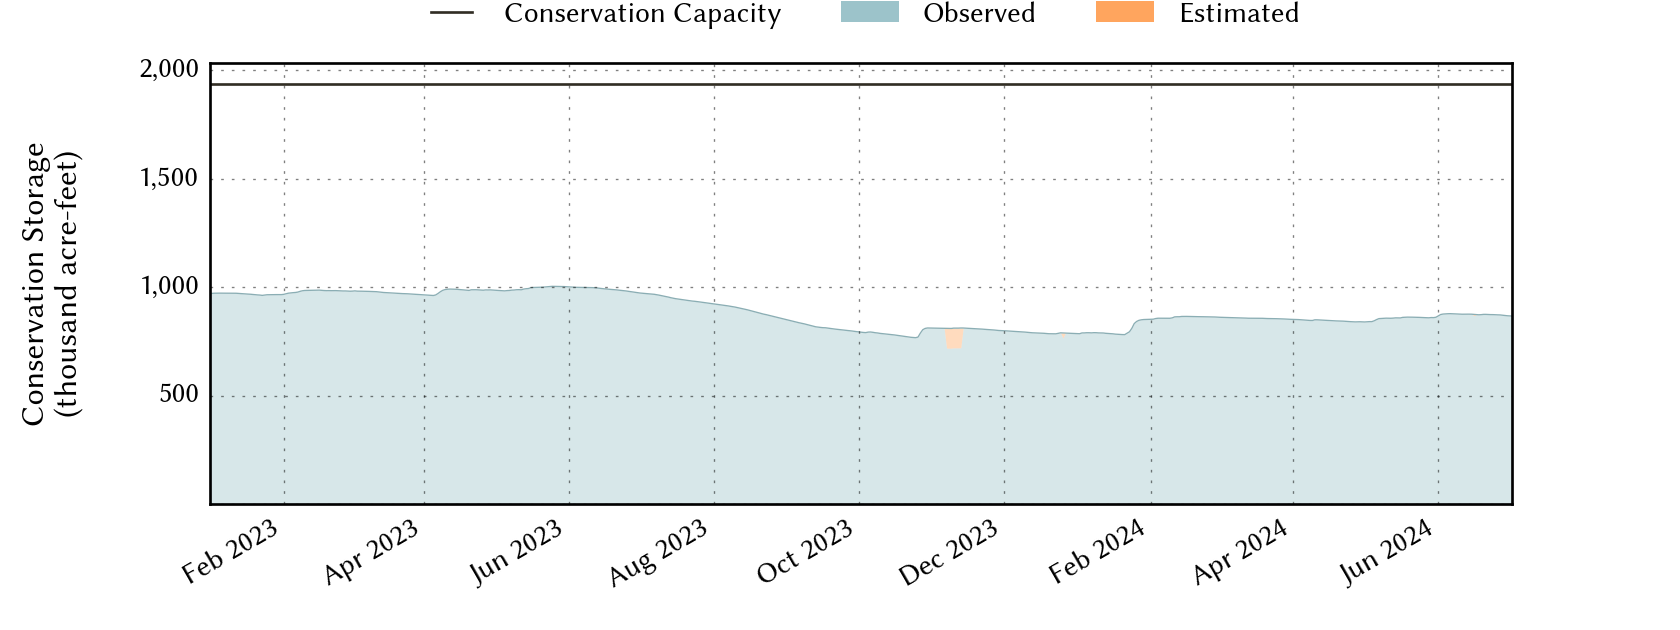
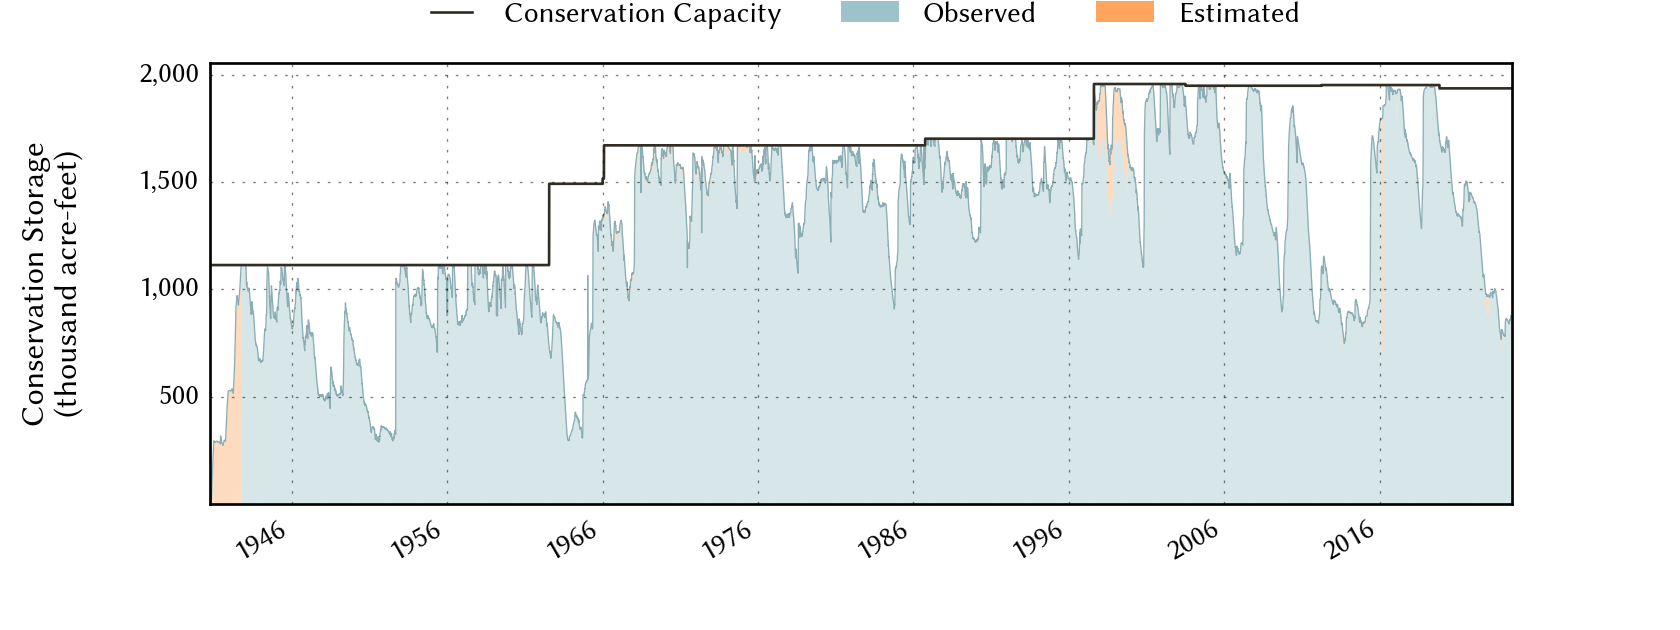
Conservation Storage (acre-ft) |
Conservation Capacity (acre-ft) |
|
|---|---|---|---|---|---|
| Today | 2025-02-23 | 43.7 | 865,103 | 847,391 | 1,936,953 |
| Yesterday | 2025-02-22 | 43.8 | 865,241 | 847,529 | 1,936,953 |
| 2 days ago | 2025-02-21 | 43.7 | 865,099 | 847,387 | 1,936,953 |
| 1 week ago | 2025-02-16 | 43.8 | 865,907 | 848,195 | 1,936,953 |
| 1 month ago | 2025-01-23 | 43.7 | 864,605 | 846,893 | 1,936,953 |
| 3 months ago | 2024-11-23 | 44.7 | 883,710 | 865,998 | 1,936,953 |
| 6 months ago | 2024-08-23 | 48.4 | 959,096 | 937,300 | 1,936,953 |
| 1 year ago | 2024-02-23 | 44.6 | 886,335 | 863,559 | 1,936,953 |
*
Percent Full is based on Conservation Storage and Conservation Capacity and doesn't account for storage in flood pool.
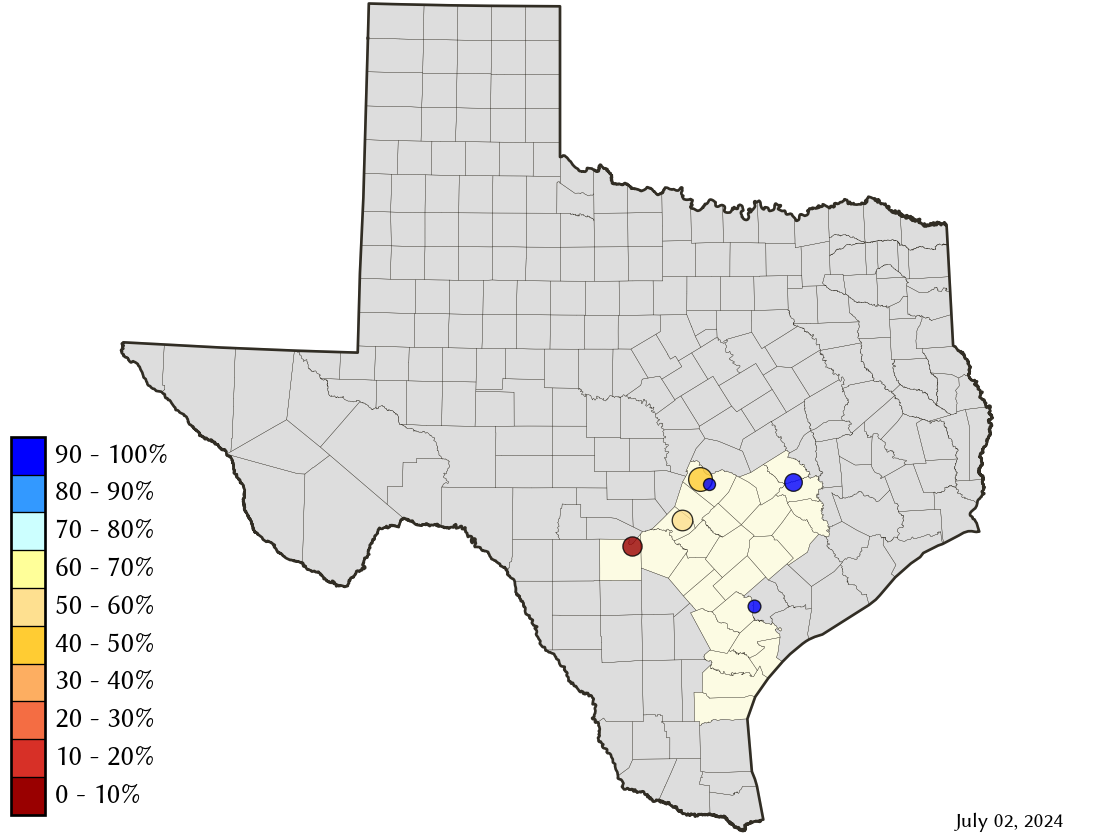
Area Map
Reservoir Storage
| Reservoir | Percent Full |
Water Level (ft) |
Height Above Conservation Pool (ft) |
Reservoir Storage (acre-ft) |
Conservation Storage (acre-ft) |
Conservation Capacity (acre-ft) |
Surface Area (acres) |
|---|---|---|---|---|---|---|---|
| Austin | 96.4 | 492.25 | -0.55 | 23,721 | 23,112 | 23,972 | 1,548 |
| Canyon | 48.7 | 879.64 | -29.36 | 184,454 | 184,383 | 378,781 | 5,149 |
| Coleto Creek | 87.9 | 96.42 | -1.58 | 27,279 | 27,279 | 31,040 | 2,430 |
| Medina | 2.4 | 971.10 | -93.10 | 6,156 | 6,156 | 254,823 | 571 |
| Somerville | 85.8 | 236.02 | -1.98 | 128,879 | 128,879 | 150,293 | 10,443 |
| Travis | 43.5 | 637.53 | -43.47 | 494,614 | 477,582 | 1,098,044 | 10,253 |