Lower-Colorado Planning Region Reservoirs: Monitored Water Supply Reservoirs are 53.6% full on 2025-02-23
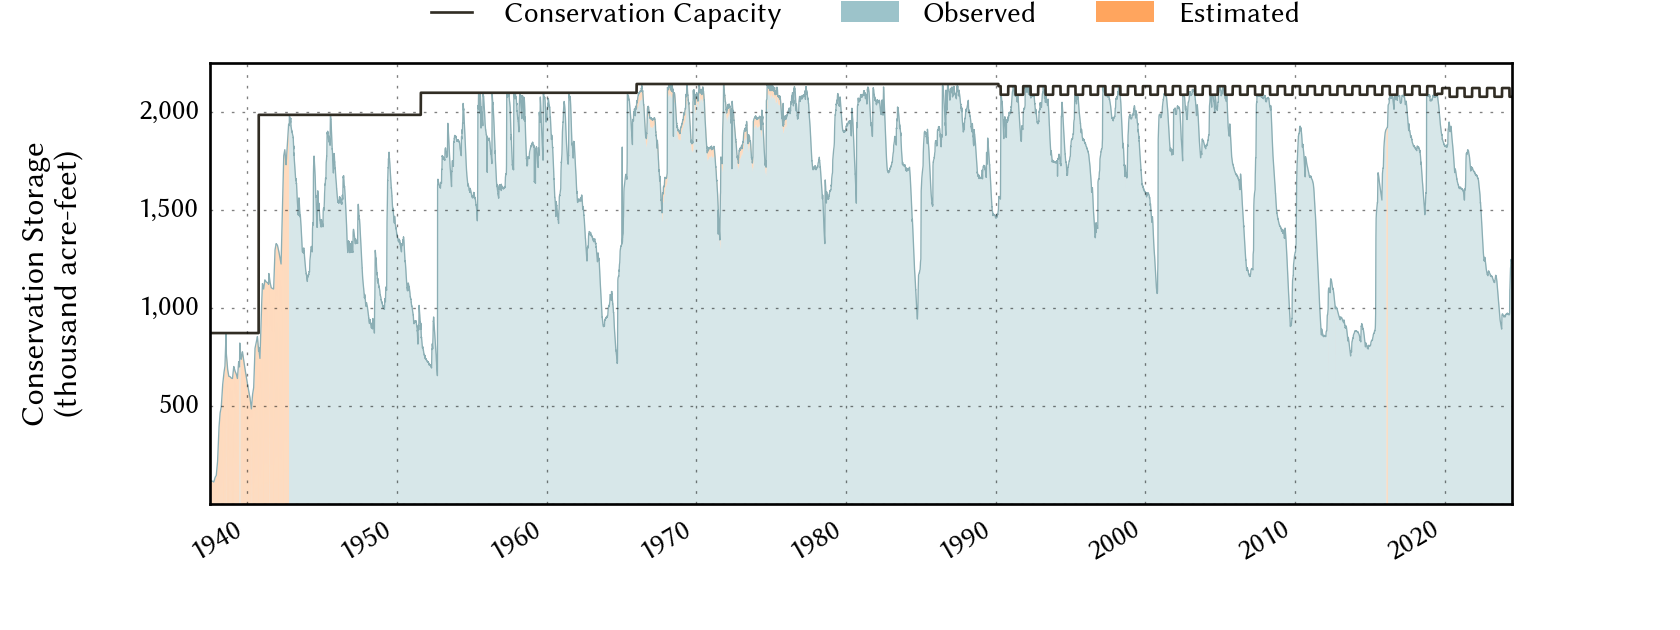
Historical Data
| Date | Percent Full |
Reservoir Storage (acre-ft) |
Conservation Storage (acre-ft) |
Conservation Capacity (acre-ft) |
|
|---|---|---|---|---|---|
| Today | 2025-02-23 | 53.6 | 1,189,091 | 1,138,665 | 2,122,814 |
| Yesterday | 2025-02-22 | 53.6 | 1,189,121 | 1,138,695 | 2,122,814 |
| 2 days ago | 2025-02-21 | 53.6 | 1,188,756 | 1,138,330 | 2,122,814 |
| 1 week ago | 2025-02-16 | 53.9 | 1,194,116 | 1,143,690 | 2,122,814 |
| 1 month ago | 2025-01-23 | 54.1 | 1,199,777 | 1,149,351 | 2,122,814 |
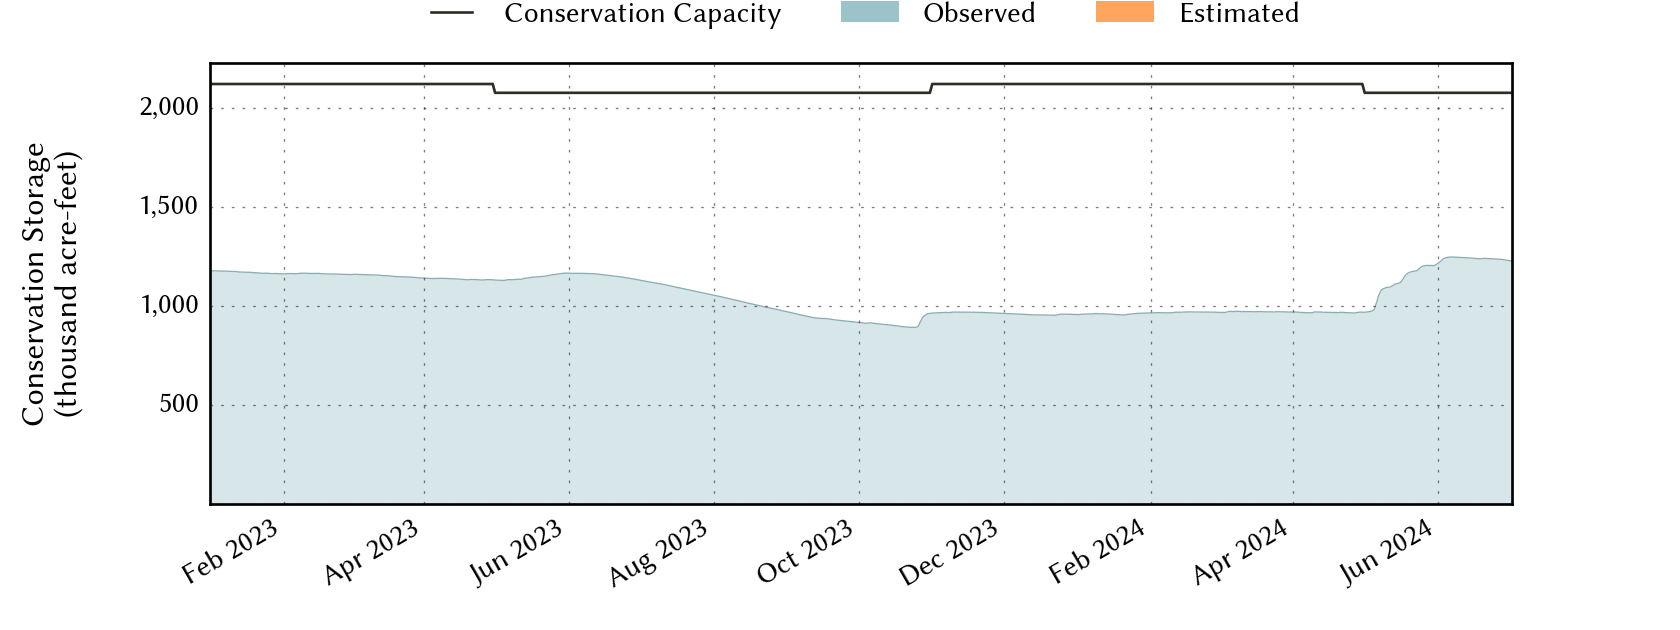
| 3 months ago | 2024-11-23 | 56.4 | 1,248,104 | 1,197,678 | 2,122,814 |
| 6 months ago | 2024-08-23 | 60.0 | 1,298,306 | 1,247,880 | 2,078,327 |
| 1 year ago | 2024-02-23 | 45.7 | 1,020,597 | 970,171 | 2,122,814 |
*
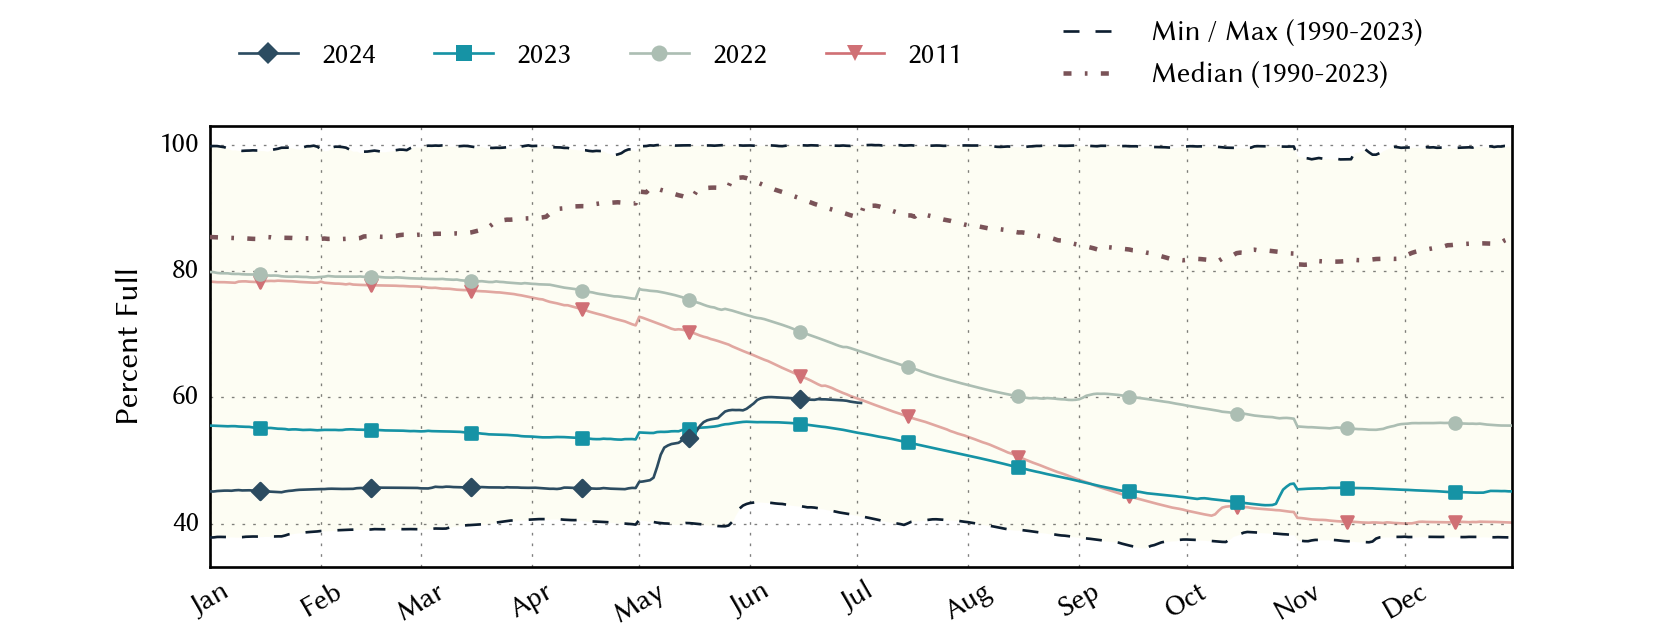
Percent Full is based on Conservation Storage and Conservation Capacity and doesn't account for storage in flood pool.
Area Map
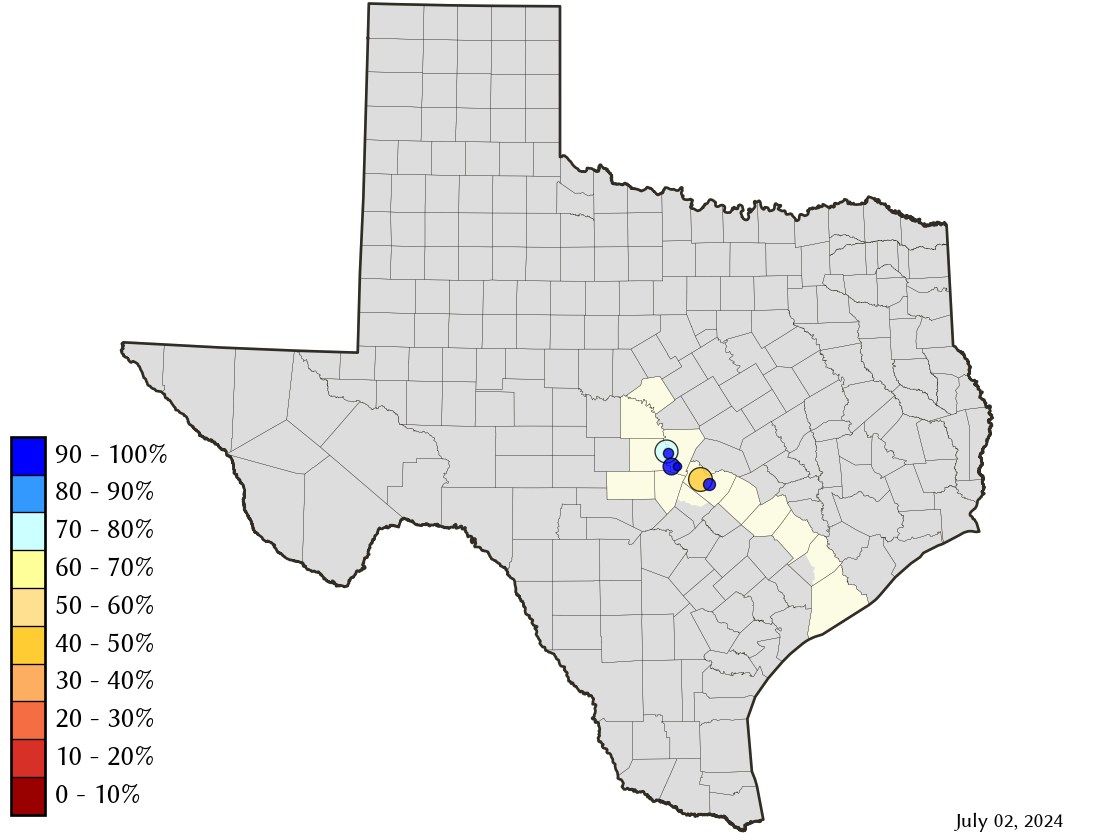
Reservoir Storage
| Reservoir | Percent Full |
Water Level (ft) |
Height Above Conservation Pool (ft) |
Reservoir Storage (acre-ft) |
Conservation Storage (acre-ft) |
Conservation Capacity (acre-ft) |
Surface Area (acres) |
|---|---|---|---|---|---|---|---|
| Austin | 96.4 | 492.25 | -0.55 | 23,721 | 23,112 | 23,972 | 1,548 |
| Buchanan | 58.6 | 1,001.94 | -18.06 | 521,238 | 507,576 | 866,694 | 16,528 |
| Inks | 95.0 | 887.13 | -0.87 | 13,320 | 13,037 | 13,729 | 784 |
| Lyndon B Johnson | 97.7 | 824.59 | -0.41 | 128,989 | 110,149 | 112,778 | 6,393 |
| Marble Falls | 94.9 | 736.36 | -0.64 | 7,209 | 7,209 | 7,597 | 601 |
| Travis | 43.5 | 637.53 | -43.47 | 494,614 | 477,582 | 1,098,044 | 10,253 |