San Angelo Area Reservoirs: Monitored Water Supply Reservoirs are 29.4% full on 2025-02-23
Historical Data
| Date | Percent Full |
Reservoir Storage (acre-ft) |
Conservation Storage (acre-ft) |
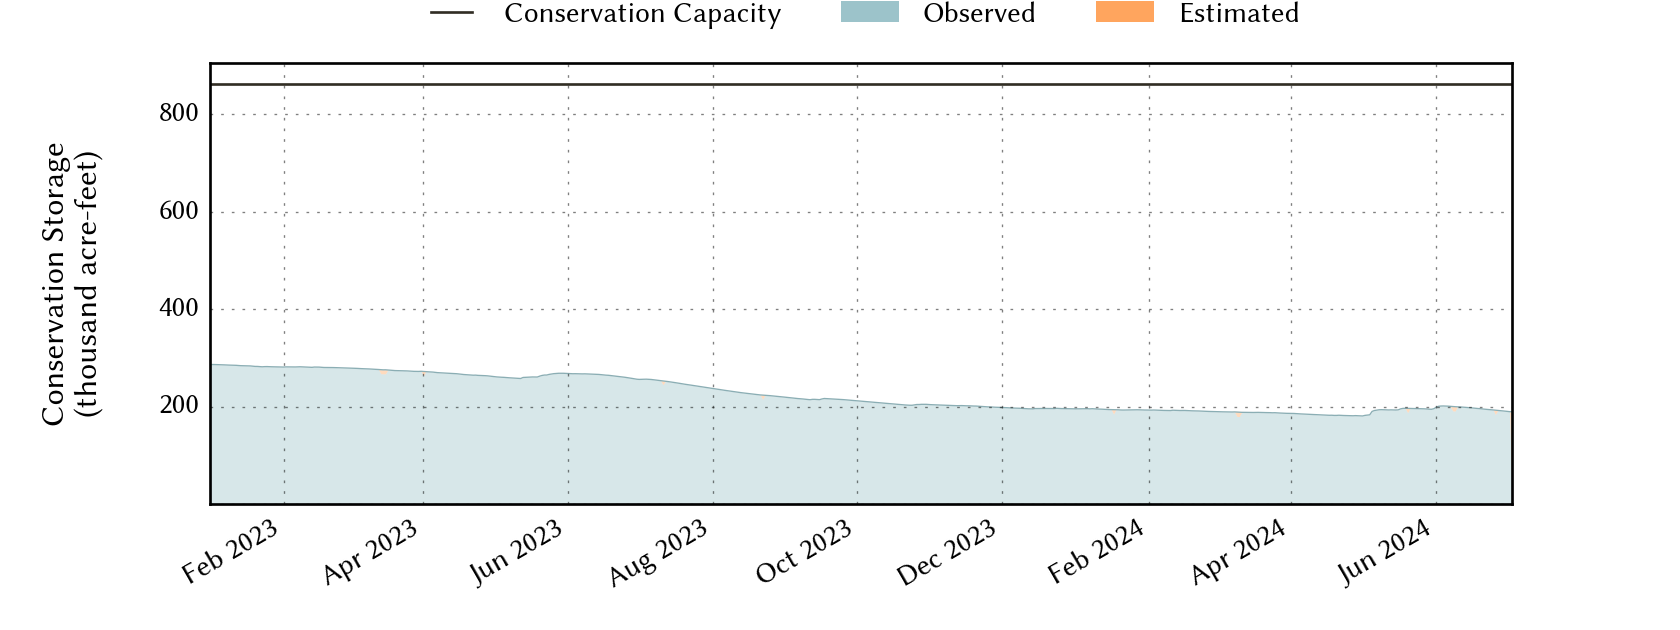
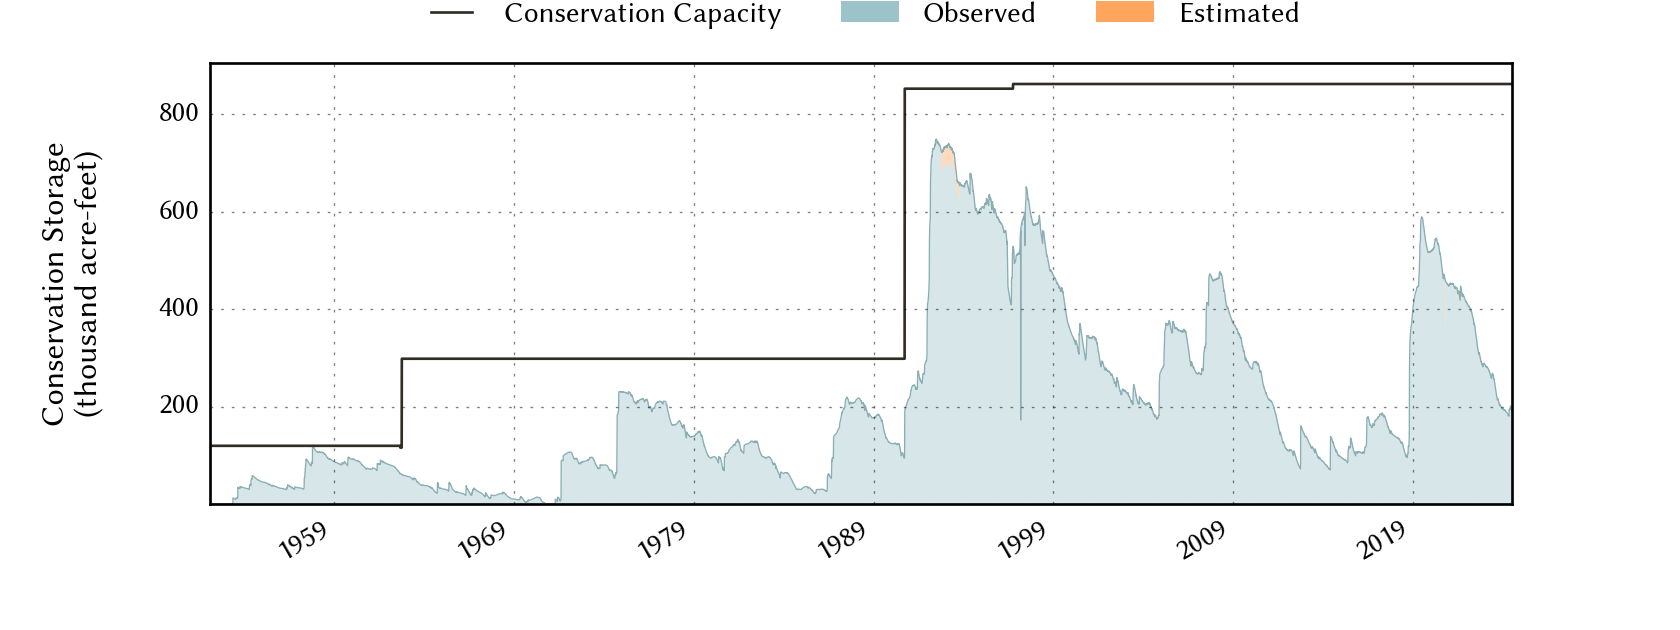
Conservation Capacity (acre-ft) |
|
|---|---|---|---|---|---|
| Today | 2025-02-23 | 29.4 | 257,484 | 253,241 | 862,151 |
| Yesterday | 2025-02-22 | 29.4 | 257,493 | 253,250 | 862,151 |
| 2 days ago | 2025-02-21 | 29.4 | 257,507 | 253,264 | 862,151 |
| 1 week ago | 2025-02-16 | 29.5 | 258,628 | 254,385 | 862,151 |
| 1 month ago | 2025-01-23 | 29.5 | 258,646 | 254,403 | 862,151 |
| 3 months ago | 2024-11-23 | 30.6 | 267,826 | 263,583 | 862,151 |
| 6 months ago | 2024-08-23 | 19.5 | 172,151 | 167,908 | 862,151 |
| 1 year ago | 2024-02-23 | 22.1 | 194,881 | 190,638 | 862,151 |
*
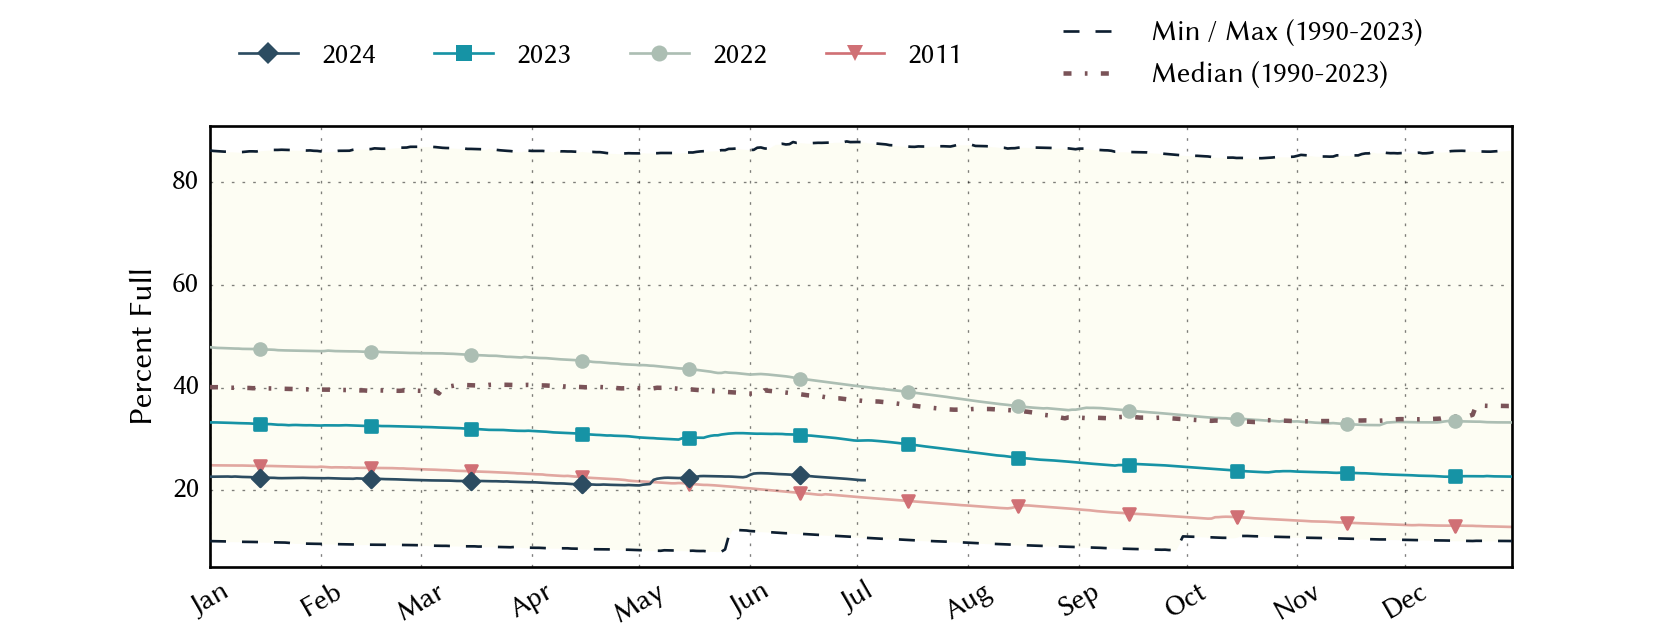
Percent Full is based on Conservation Storage and Conservation Capacity and doesn't account for storage in flood pool.
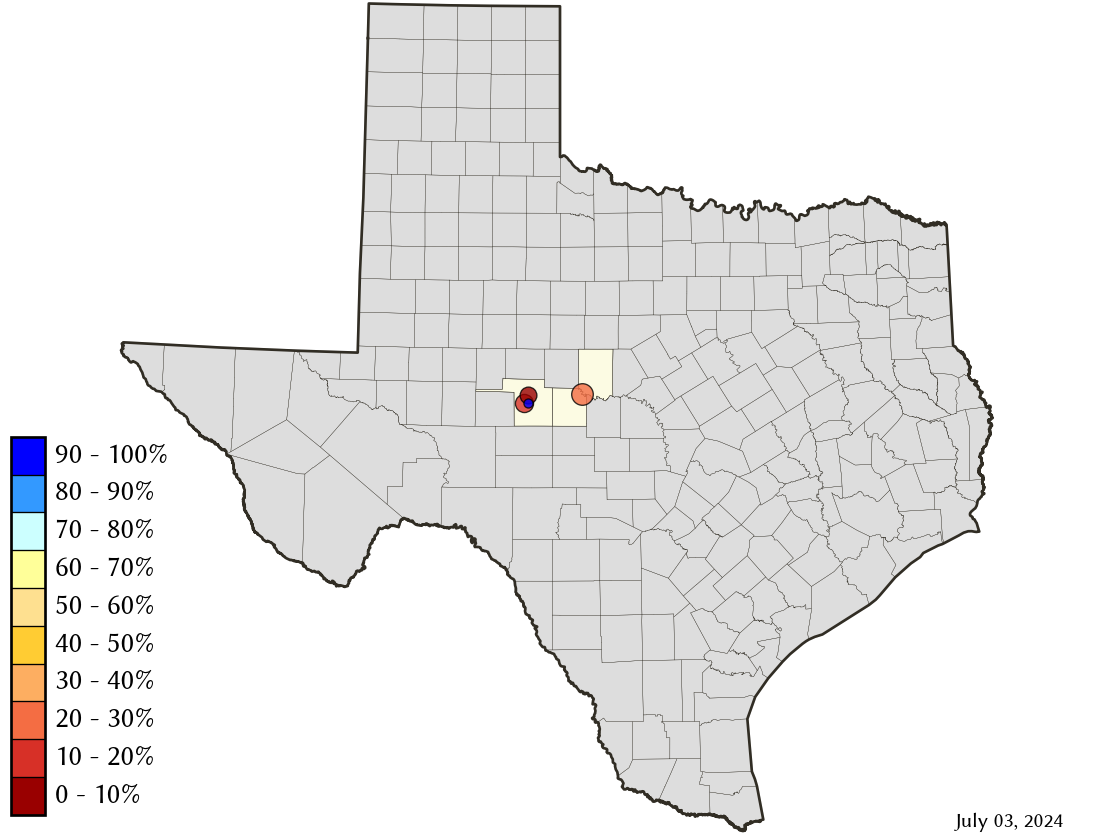
Area Map
Reservoir Storage
| Reservoir | Percent Full |
Water Level (ft) |
Height Above Conservation Pool (ft) |
Reservoir Storage (acre-ft) |
Conservation Storage (acre-ft) |
Conservation Capacity (acre-ft) |
Surface Area (acres) |
|---|---|---|---|---|---|---|---|
| Nasworthy | 92.7 | 1,871.76 | -0.44 | 9,403 | 8,910 | 9,615 | 1,274 |
| O C Fisher | 7.9 | 1,868.70 | -39.30 | 9,137 | 9,136 | 115,742 | 828 |
| O H Ivie | 39.6 | 1,528.36 | -23.14 | 219,750 | 219,750 | 554,340 | - n.a. - |
| Twin Buttes | 8.5 | 1,900.62 | -39.58 | 19,194 | 15,445 | 182,454 | 1,400 |