Coastal-Bend Planning Region Reservoirs: Monitored Water Supply Reservoirs are 18.0% full on 2025-02-23
Historical Data
| Date | Percent Full |
Reservoir Storage (acre-ft) |
Conservation Storage (acre-ft) |
Conservation Capacity (acre-ft) |
|
|---|---|---|---|---|---|
| Today | 2025-02-23 | 18.0 | 165,461 | 165,182 | 918,882 |
| Yesterday | 2025-02-22 | 18.0 | 165,895 | 165,616 | 918,882 |
| 2 days ago | 2025-02-21 | 18.1 | 166,330 | 166,051 | 918,882 |
| 1 week ago | 2025-02-16 | 18.4 | 168,953 | 168,674 | 918,882 |
| 1 month ago | 2025-01-23 | 18.7 | 172,229 | 171,950 | 918,882 |
| 3 months ago | 2024-11-23 | 20.6 | 189,144 | 188,865 | 918,882 |
| 6 months ago | 2024-08-23 | 24.9 | 228,921 | 228,642 | 918,882 |
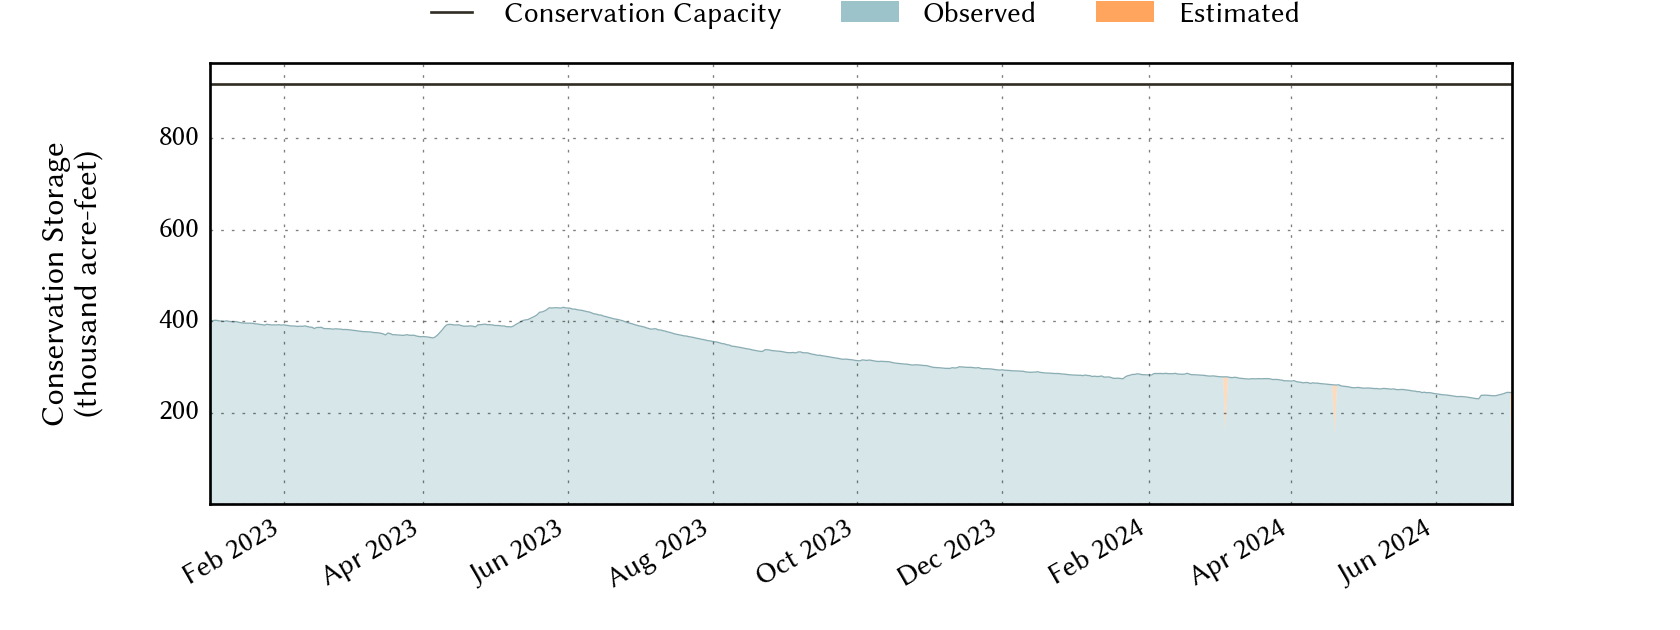
| 1 year ago | 2024-02-23 | 30.7 | 282,329 | 282,050 | 918,882 |
*
Percent Full is based on Conservation Storage and Conservation Capacity and doesn't account for storage in flood pool.
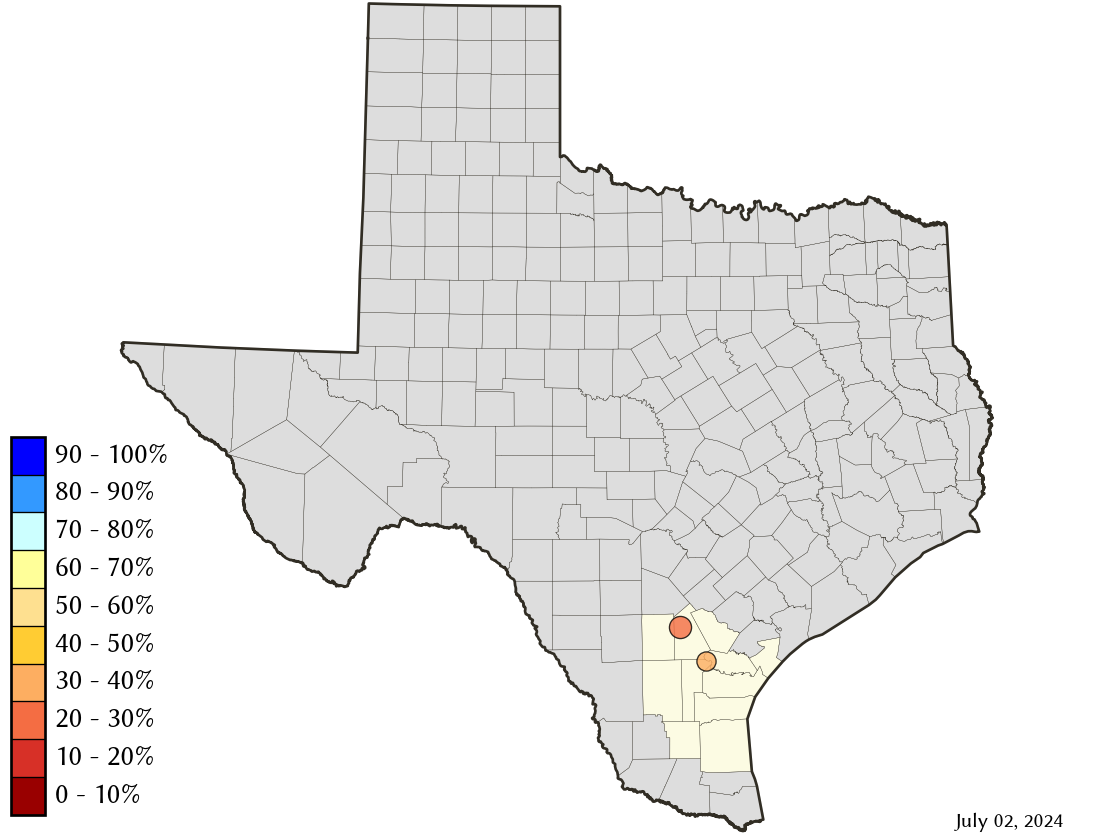
Area Map
Reservoir Storage
| Reservoir | Percent Full |
Water Level (ft) |
Height Above Conservation Pool (ft) |
Reservoir Storage (acre-ft) |
Conservation Storage (acre-ft) |
Conservation Capacity (acre-ft) |
Surface Area (acres) |
|---|---|---|---|---|---|---|---|
| Choke Canyon | 15.9 | 186.80 | -33.70 | 105,302 | 105,301 | 662,820 | 8,613 |
| Corpus Christi | 23.4 | 80.62 | -13.38 | 60,159 | 59,881 | 256,062 | 8,674 |