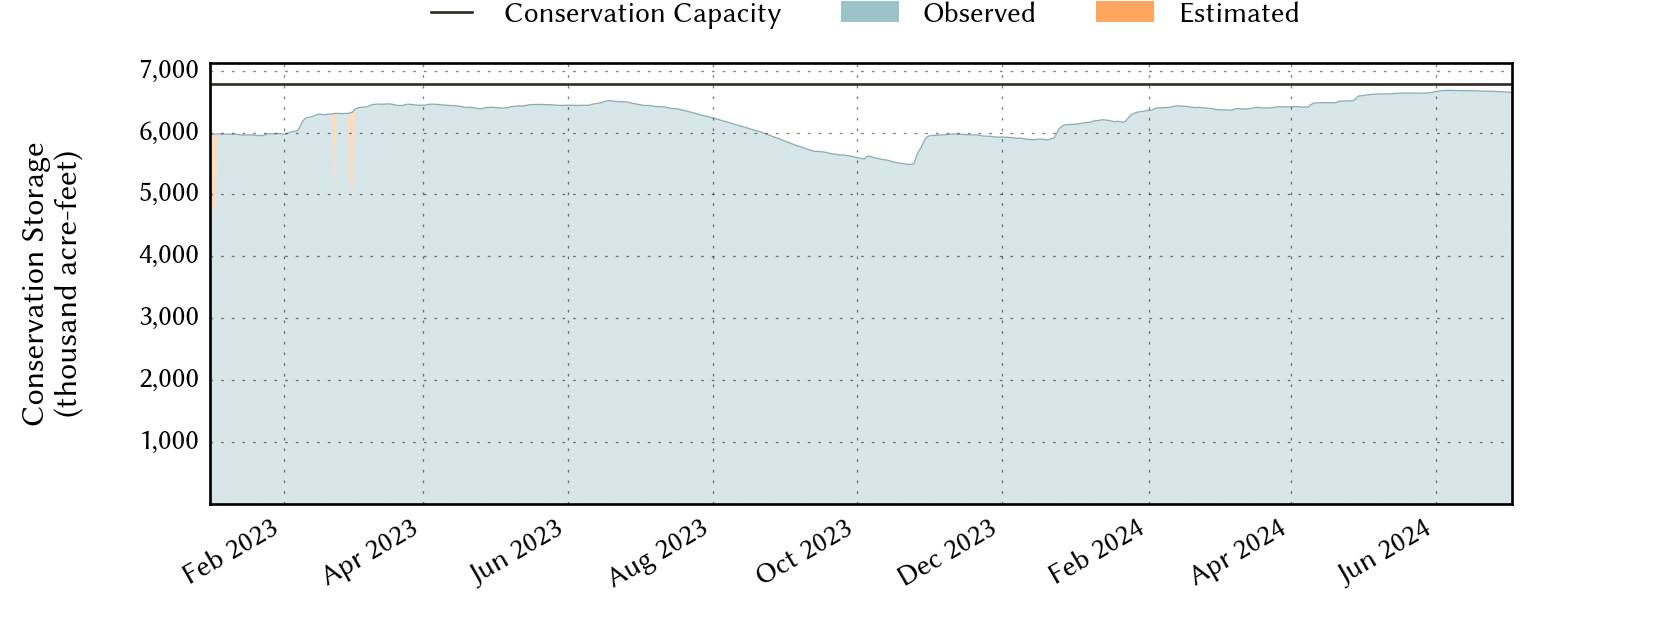
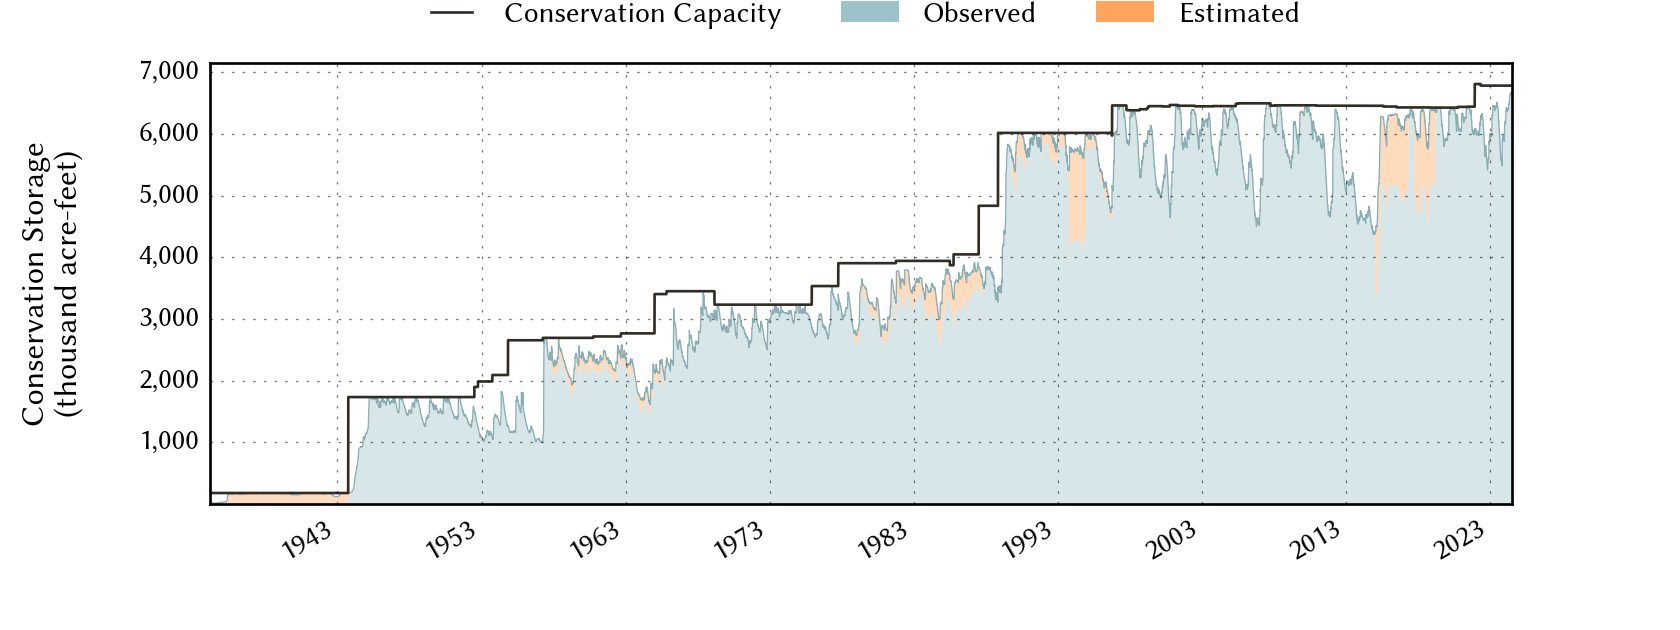
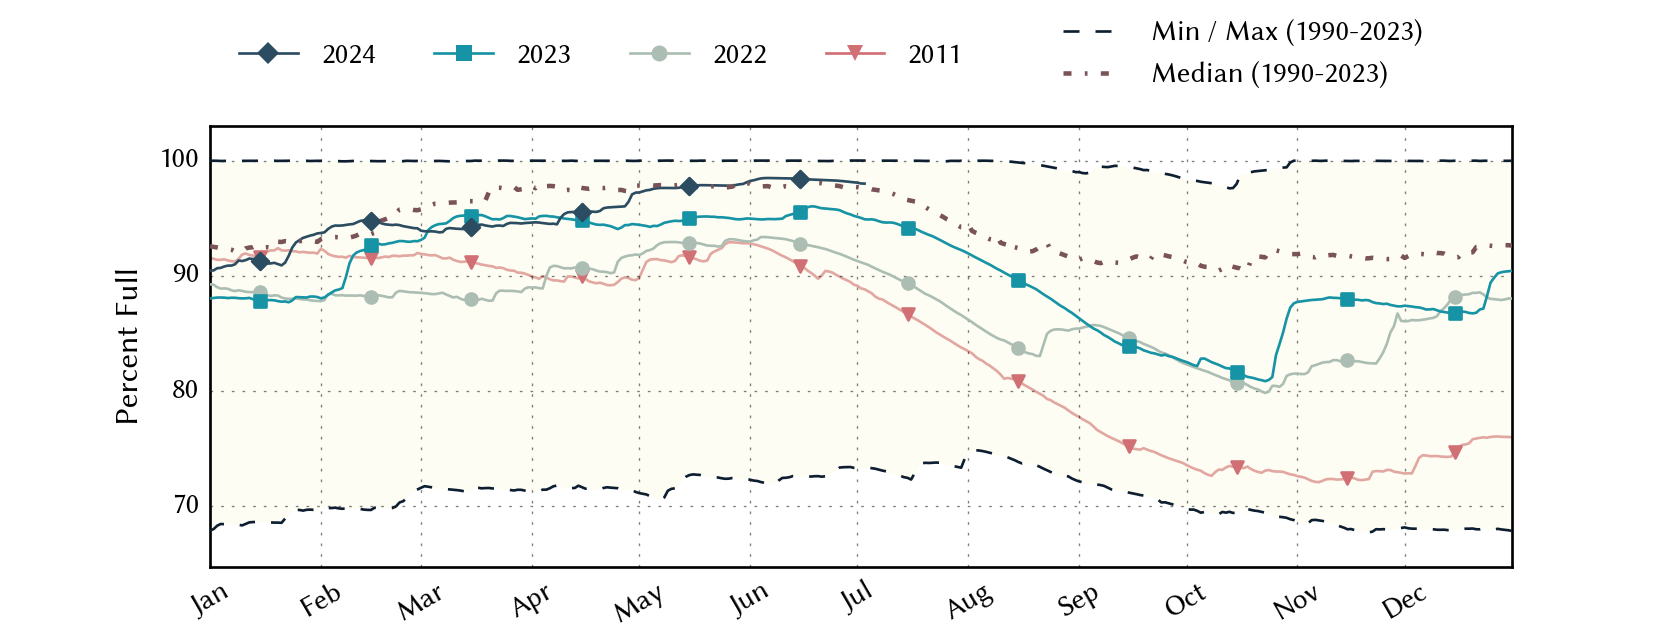
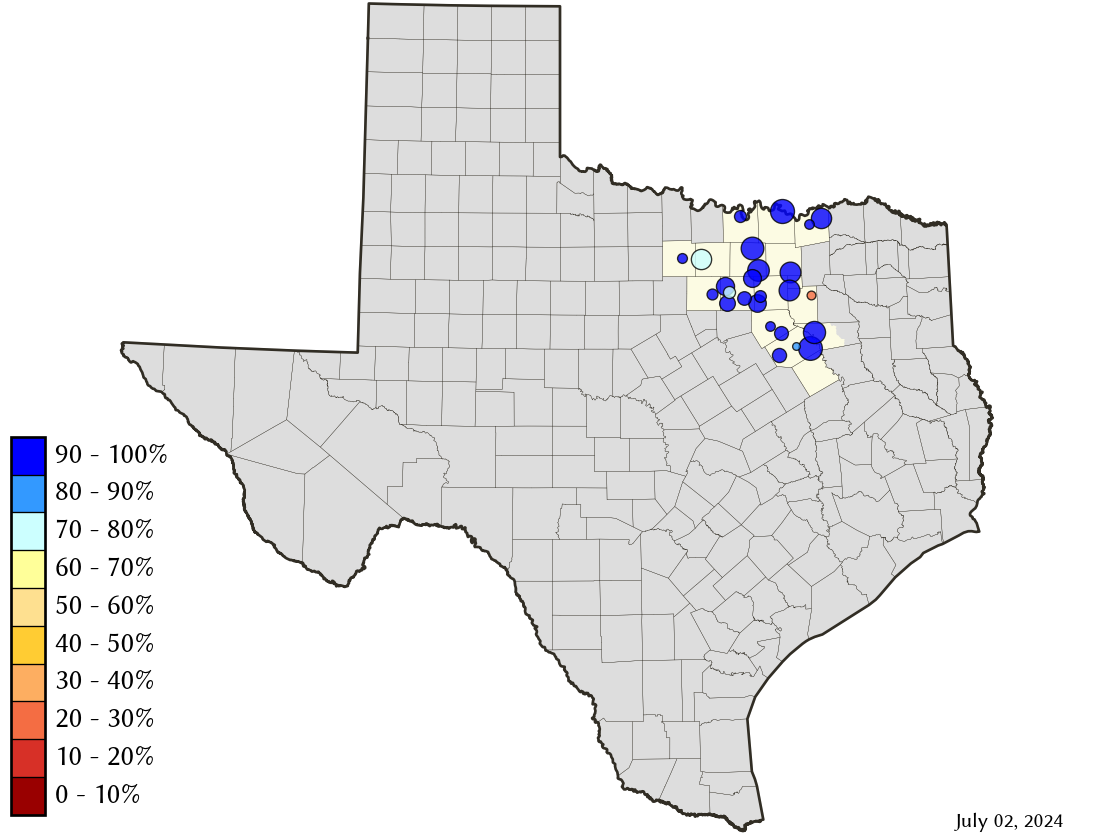
Region-C Planning Region Reservoirs: Monitored Water Supply Reservoirs are 94.0% full on 2025-02-23
Historical Data
| Date | Percent Full |
Reservoir Storage (acre-ft) |
Conservation Storage (acre-ft) |
Conservation Capacity (acre-ft) |
|
|---|---|---|---|---|---|
| Today | 2025-02-23 | 94.0 | 7,586,736 | 6,378,306 | 6,783,467 |
| Yesterday | 2025-02-22 | 94.0 | 7,588,515 | 6,379,806 | 6,783,467 |
| 2 days ago | 2025-02-21 | 94.1 | 7,599,955 | 6,385,909 | 6,783,467 |
| 1 week ago | 2025-02-16 | 94.7 | 7,689,439 | 6,422,232 | 6,783,467 |
| 1 month ago | 2025-01-23 | 90.9 | 7,434,479 | 6,165,426 | 6,783,467 |
| 3 months ago | 2024-11-23 | 89.8 | 7,540,714 | 6,093,187 | 6,783,467 |
| 6 months ago | 2024-08-23 | 94.8 | 7,728,862 | 6,429,282 | 6,783,467 |
| 1 year ago | 2024-02-23 | 94.4 | 7,725,580 | 6,402,716 | 6,783,467 |
*
Percent Full is based on Conservation Storage and Conservation Capacity and doesn't account for storage in flood pool.
Area Map
Reservoir Storage
| Reservoir | Percent Full |
Water Level (ft) |
Height Above Conservation Pool (ft) |
Reservoir Storage (acre-ft) |
Conservation Storage (acre-ft) |
Conservation Capacity (acre-ft) |
Surface Area (acres) |
|---|---|---|---|---|---|---|---|
| Arlington | 99.5 | 549.90 | -0.10 | 39,996 | 39,964 | 40,157 | 1,921 |
| Bardwell | 100.0 | 421.21 | 0.21 | 44,614 | 43,856 | 43,856 | 3,326 |
| Benbrook | 93.2 | 692.38 | -1.62 | 79,849 | 79,849 | 85,648 | 3,496 |
| Bois d'Arc | 87.3 | 531.12 | -2.88 | 320,992 | 320,992 | 367,609 | 15,249 |
| Bonham | 91.0 | 564.04 | -0.96 | 10,050 | 10,038 | 11,027 | 1,008 |
| Bridgeport | 72.6 | 826.93 | -9.07 | 270,044 | 270,044 | 372,183 | 10,207 |
| Cedar Creek | 99.4 | 321.88 | -0.12 | 640,864 | 640,765 | 644,686 | 32,589 |
| Eagle Mountain | 79.6 | 644.70 | -4.40 | 147,355 | 147,355 | 185,087 | 7,994 |
| Grapevine | 100.0 | 535.71 | 0.71 | 167,809 | 163,064 | 163,064 | - n.a. - |
| Halbert | 89.1 | 366.83 | -1.17 | 5,373 | 5,373 | 6,033 | 551 |
| Hubert H Moss | 99.0 | 714.78 | -0.22 | 23,918 | 23,821 | 24,058 | 1,075 |
| Joe Pool | 100.0 | 522.23 | 0.23 | 152,545 | 149,629 | 149,629 | 6,749 |
| Lavon | 100.0 | 492.25 | 0.25 | 417,774 | 409,757 | 409,757 | 20,824 |
| Lewisville | 92.9 | 520.50 | -1.50 | 559,139 | 523,465 | 563,228 | 26,045 |
| Lost Creek | 98.9 | 1,009.19 | -0.31 | 11,820 | 11,820 | 11,950 | - n.a. - |
| Mountain Creek | 100.0 | 457.65 | 0.65 | 24,569 | 22,850 | 22,850 | 2,874 |
| Navarro Mills | 100.0 | 424.58 | 0.08 | 50,204 | 49,827 | 49,827 | - n.a. - |
| New Terrell City | 38.8 | 496.40 | -7.60 | 3,338 | 3,327 | 8,583 | 491 |
| Ray Hubbard | 100.0 | 435.49 | -0.01 | 439,350 | 439,350 | 439,559 | 20,935 |
| Ray Roberts | 97.4 | 631.78 | -0.72 | 768,238 | 767,915 | 788,167 | 27,895 |
| Richland-Chambers | 100.0 | 315.05 | 0.05 | 1,127,395 | 1,099,417 | 1,099,417 | - n.a. - |
| Texoma 1 | 89.7 | 613.38 | -3.62 | 2,231,531 | 1,115,765 | 1,243,801 | 65,986 |
| Waxahachie | 100.0 | 531.87 | 0.37 | 11,890 | 11,060 | 11,060 | 680 |
| Weatherford | 72.4 | 891.12 | -4.88 | 12,899 | 12,899 | 17,812 | 938 |
| Worth | 65.9 | 591.46 | -2.54 | 25,180 | 16,104 | 24,419 | 3,098 |
footnotes
1
Lake Texoma straddles the border of Texas and Oklahoma, Texas has rights to 50% of Lake Texoma's total conservation capacity. Percent full, conservation storage and conservation capacity are based on the Texas share.