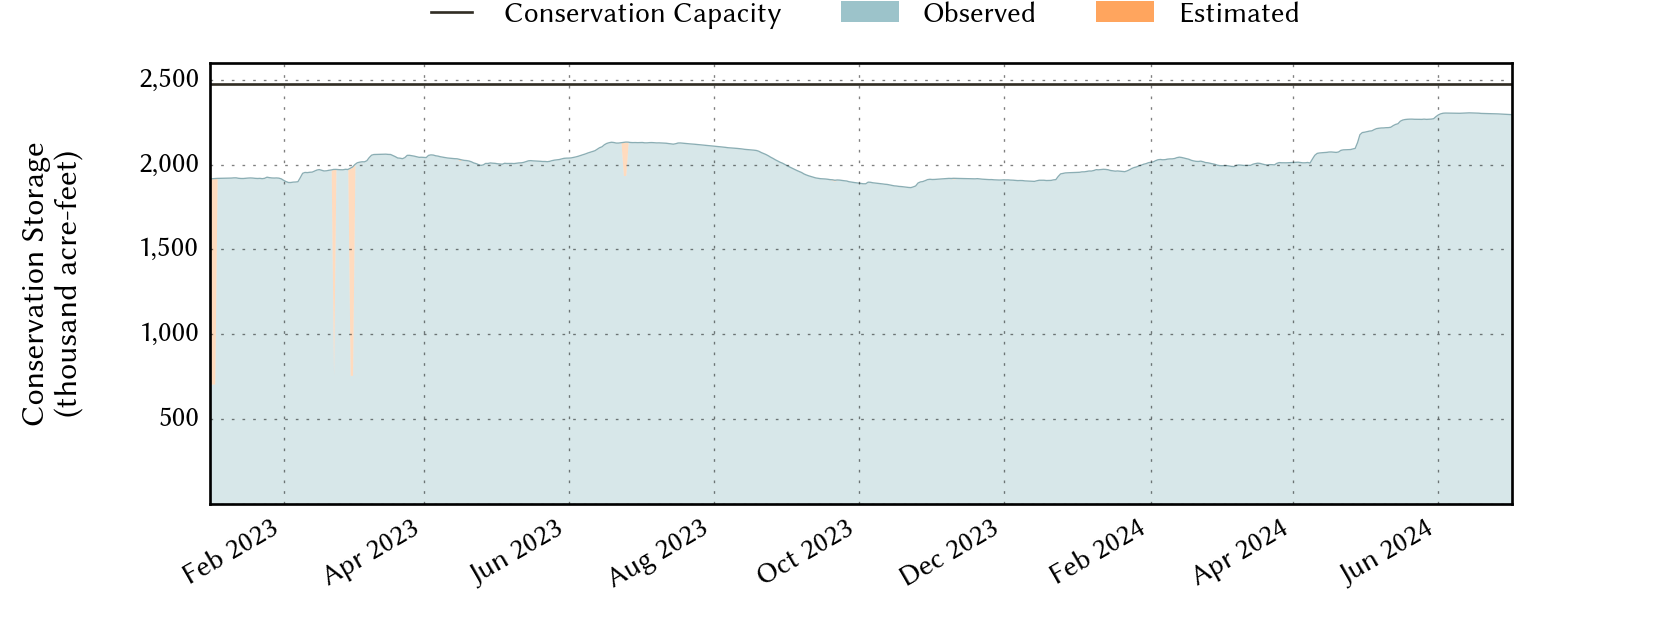
Red River Basin Reservoirs: Monitored Water Supply Reservoirs are 84.3% full on 2025-02-23
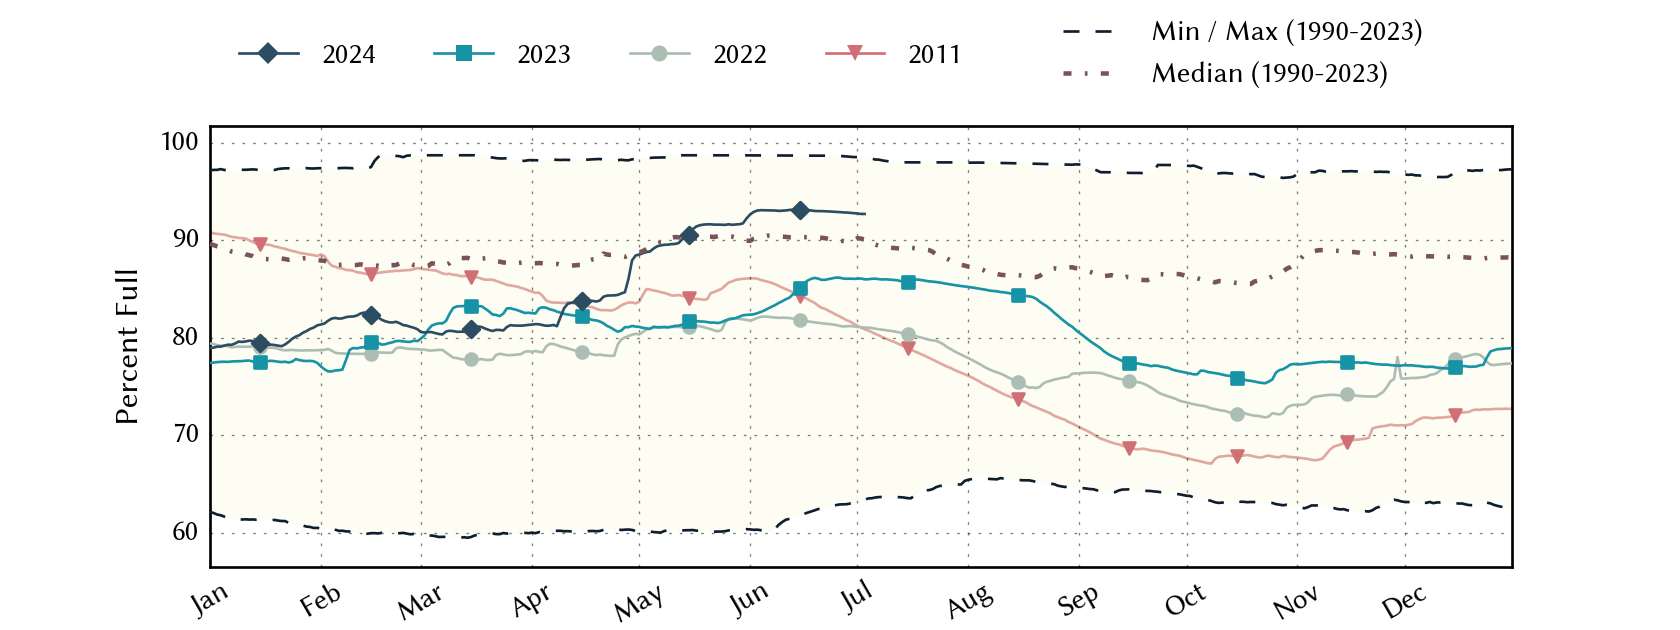
Historical Data
| Date | Percent Full |
Reservoir Storage (acre-ft) |
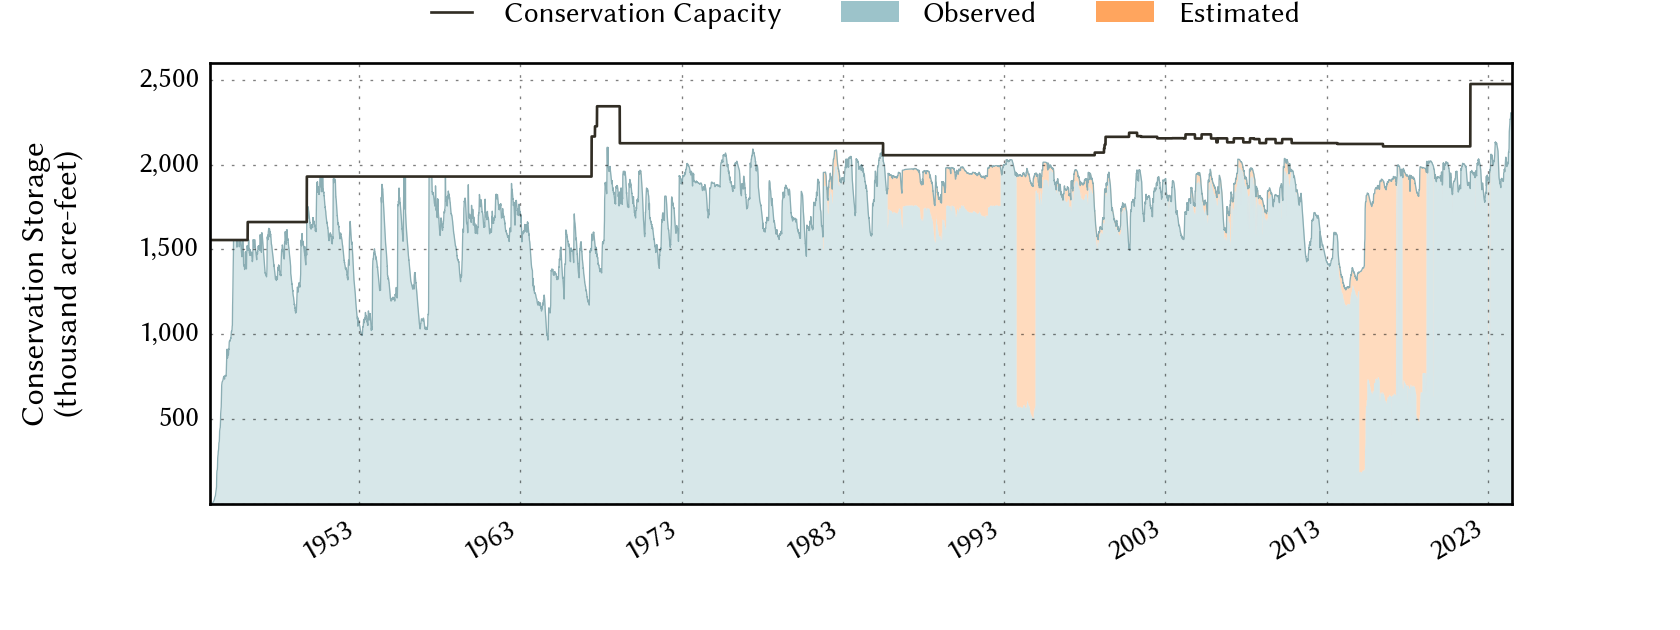
Conservation Storage (acre-ft) |
Conservation Capacity (acre-ft) |
|
|---|---|---|---|---|---|
| Today | 2025-02-23 | 84.3 | 3,218,149 | 2,085,503 | 2,474,646 |
| Yesterday | 2025-02-22 | 84.3 | 3,219,655 | 2,086,390 | 2,474,646 |
| 2 days ago | 2025-02-21 | 84.5 | 3,229,544 | 2,090,959 | 2,474,646 |
| 1 week ago | 2025-02-16 | 85.5 | 3,280,915 | 2,116,515 | 2,474,646 |
| 1 month ago | 2025-01-23 | 86.0 | 3,328,966 | 2,129,005 | 2,474,646 |
| 3 months ago | 2024-11-23 | 88.8 | 3,581,199 | 2,197,319 | 2,474,646 |
| 6 months ago | 2024-08-23 | 89.5 | 3,467,436 | 2,215,287 | 2,474,646 |
| 1 year ago | 2024-02-23 | 81.5 | 3,239,795 | 2,016,541 | 2,474,646 |
*
Percent Full is based on Conservation Storage and Conservation Capacity and doesn't account for storage in flood pool.
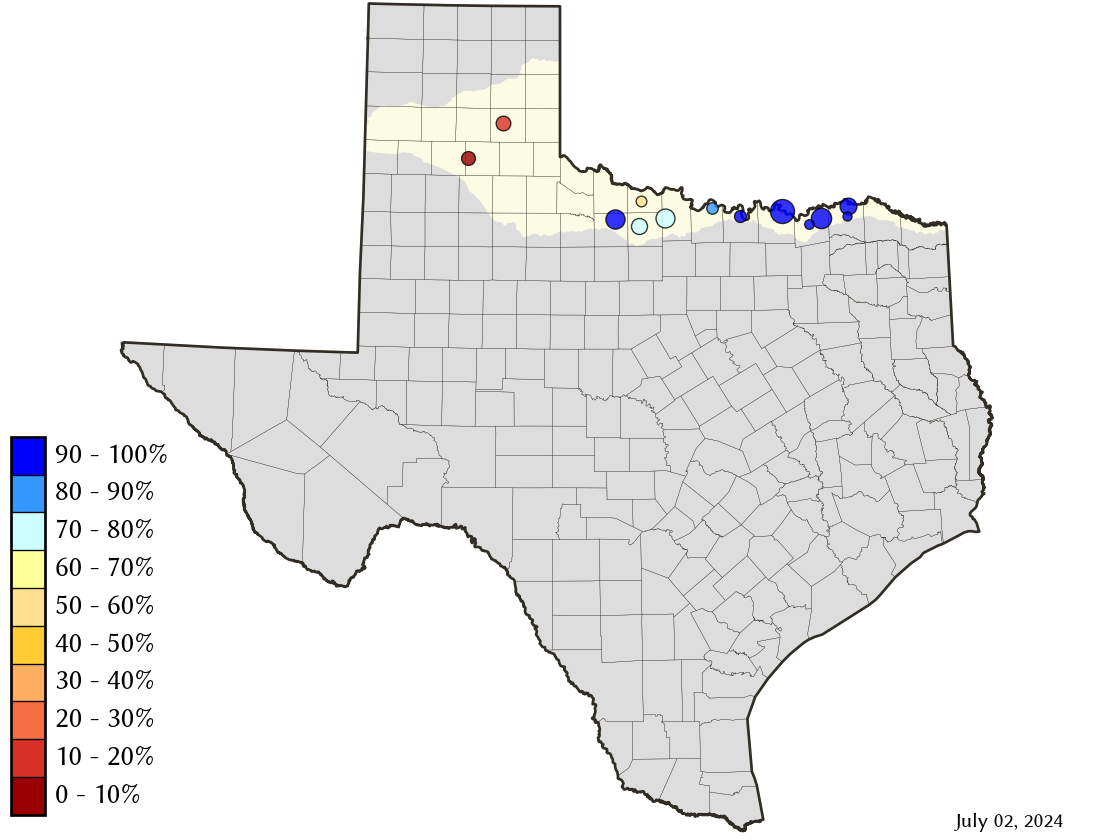
Area Map
Reservoir Storage
| Reservoir | Percent Full |
Water Level (ft) |
Height Above Conservation Pool (ft) |
Reservoir Storage (acre-ft) |
Conservation Storage (acre-ft) |
Conservation Capacity (acre-ft) |
Surface Area (acres) |
|---|---|---|---|---|---|---|---|
| Arrowhead | 67.3 | 920.21 | -5.79 | 155,016 | 155,016 | 230,359 | 11,520 |
| Bois d'Arc | 87.3 | 531.12 | -2.88 | 320,992 | 320,992 | 367,609 | 15,249 |
| Bonham | 91.0 | 564.04 | -0.96 | 10,050 | 10,038 | 11,027 | 1,008 |
| Crook | 99.5 | 475.96 | -0.04 | 9,168 | 9,153 | 9,195 | 1,054 |
| Greenbelt | 9.1 | 2,614.80 | -49.20 | 5,873 | 5,441 | 59,968 | 406 |
| Hubert H Moss | 99.0 | 714.78 | -0.22 | 23,918 | 23,821 | 24,058 | 1,075 |
| Kemp | 100.0 | 1,144.37 | 0.37 | 251,129 | 245,307 | 245,307 | - n.a. - |
| Kickapoo | 66.8 | 1,039.53 | -5.47 | 57,670 | 57,670 | 86,345 | 4,621 |
| Mackenzie | 9.1 | 3,014.31 | -85.69 | 4,207 | 4,207 | 46,450 | 208 |
| Nocona | 86.6 | 825.29 | -2.21 | 18,874 | 18,570 | 21,444 | 1,261 |
| North Fork Buffalo Creek | 37.9 | 1,040.26 | -7.74 | 5,840 | 5,840 | 15,400 | 788 |
| Pat Mayse | 100.0 | 452.06 | 1.06 | 123,881 | 113,683 | 113,683 | - n.a. - |
| Texoma 1 | 89.7 | 613.38 | -3.62 | 2,231,531 | 1,115,765 | 1,243,801 | 65,986 |
footnotes
1
Lake Texoma straddles the border of Texas and Oklahoma, Texas has rights to 50% of Lake Texoma's total conservation capacity. Percent full, conservation storage and conservation capacity are based on the Texas share.