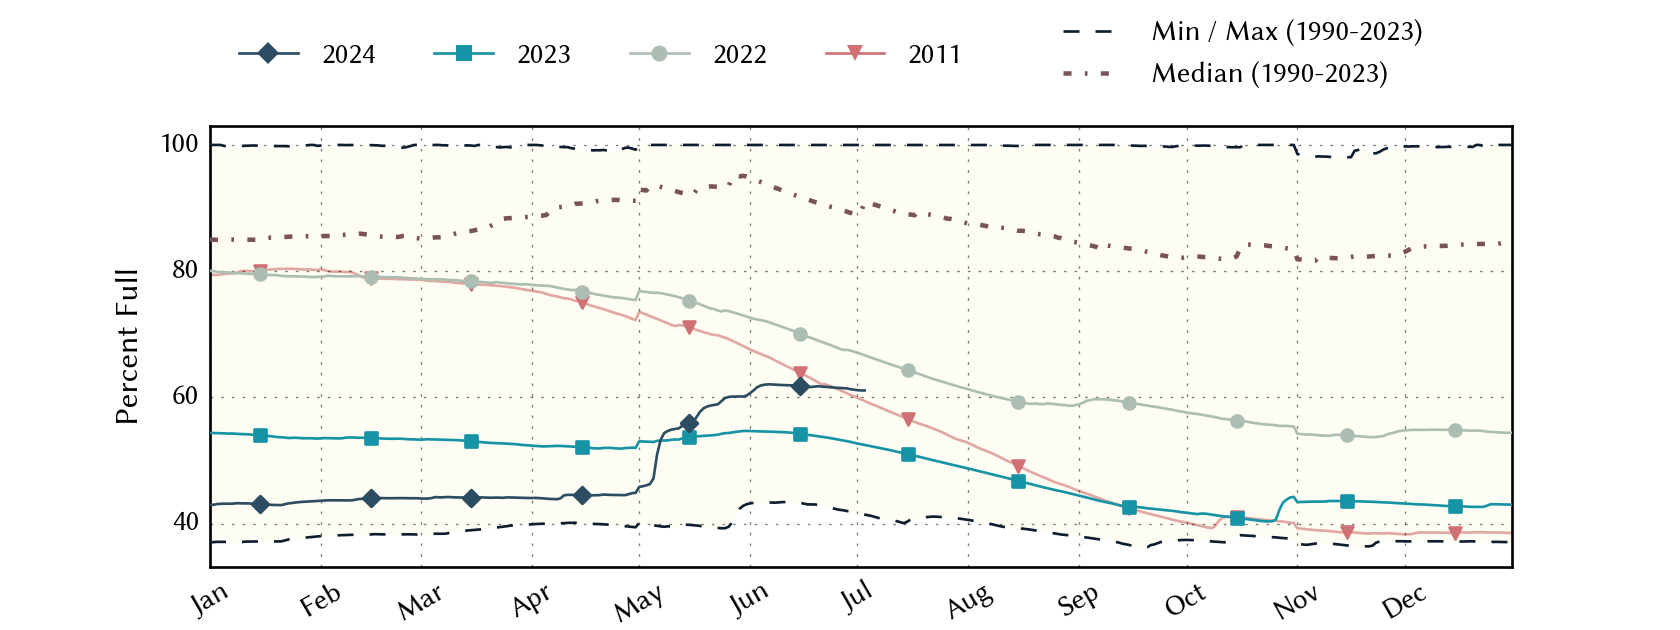
Austin Area Reservoirs: Monitored Water Supply Reservoirs are 54.7% full on 2025-02-23
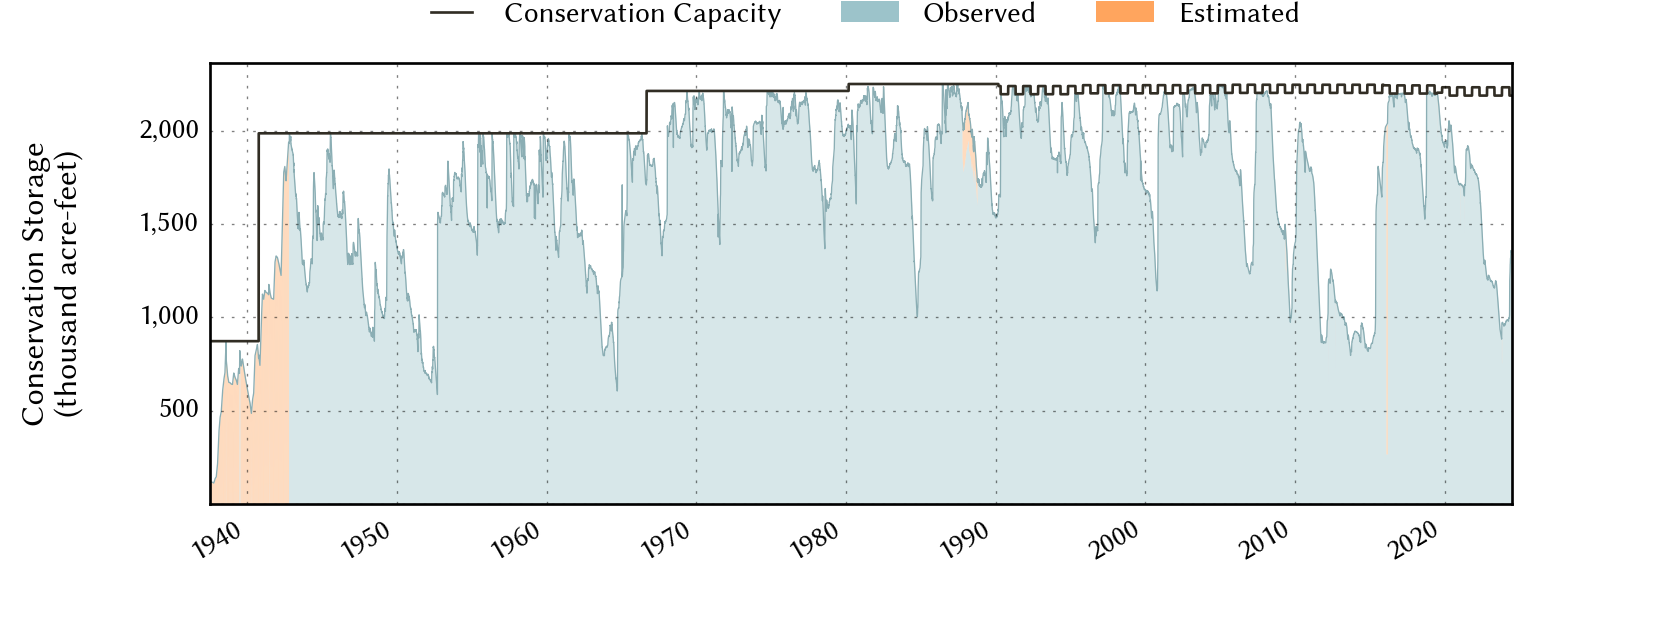
Historical Data
| Date | Percent Full |
Reservoir Storage (acre-ft) |
Conservation Storage (acre-ft) |
Conservation Capacity (acre-ft) |
|
|---|---|---|---|---|---|
| Today | 2025-02-23 | 54.7 | 1,252,261 | 1,221,418 | 2,232,539 |
| Yesterday | 2025-02-22 | 54.7 | 1,252,442 | 1,221,599 | 2,232,539 |
| 2 days ago | 2025-02-21 | 54.7 | 1,252,037 | 1,221,194 | 2,232,539 |
| 1 week ago | 2025-02-16 | 54.9 | 1,257,186 | 1,226,343 | 2,232,539 |
| 1 month ago | 2025-01-23 | 55.2 | 1,263,204 | 1,232,361 | 2,232,539 |
| 3 months ago | 2024-11-23 | 57.7 | 1,320,103 | 1,289,260 | 2,232,539 |
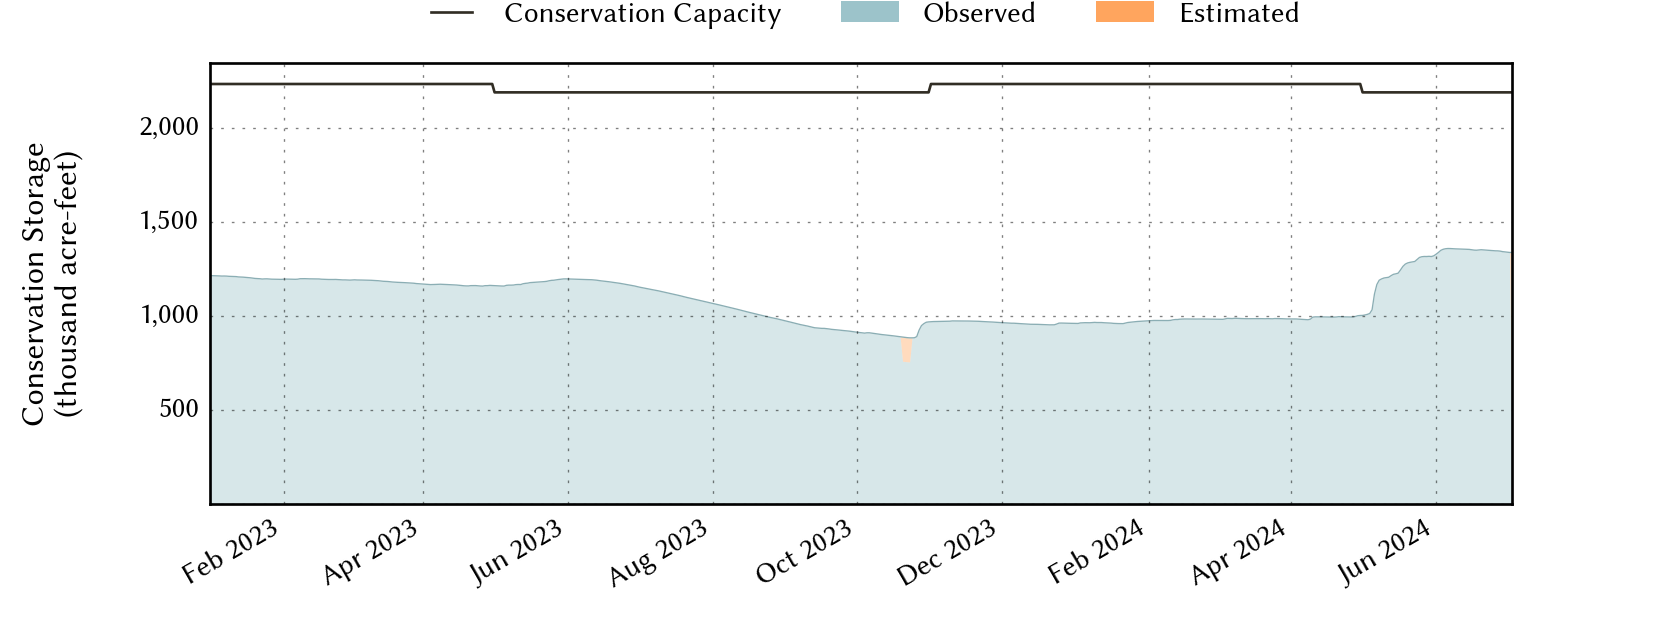
| 6 months ago | 2024-08-23 | 61.8 | 1,393,711 | 1,352,663 | 2,188,052 |
| 1 year ago | 2024-02-23 | 44.0 | 1,014,094 | 983,251 | 2,232,539 |
*
Percent Full is based on Conservation Storage and Conservation Capacity and doesn't account for storage in flood pool.
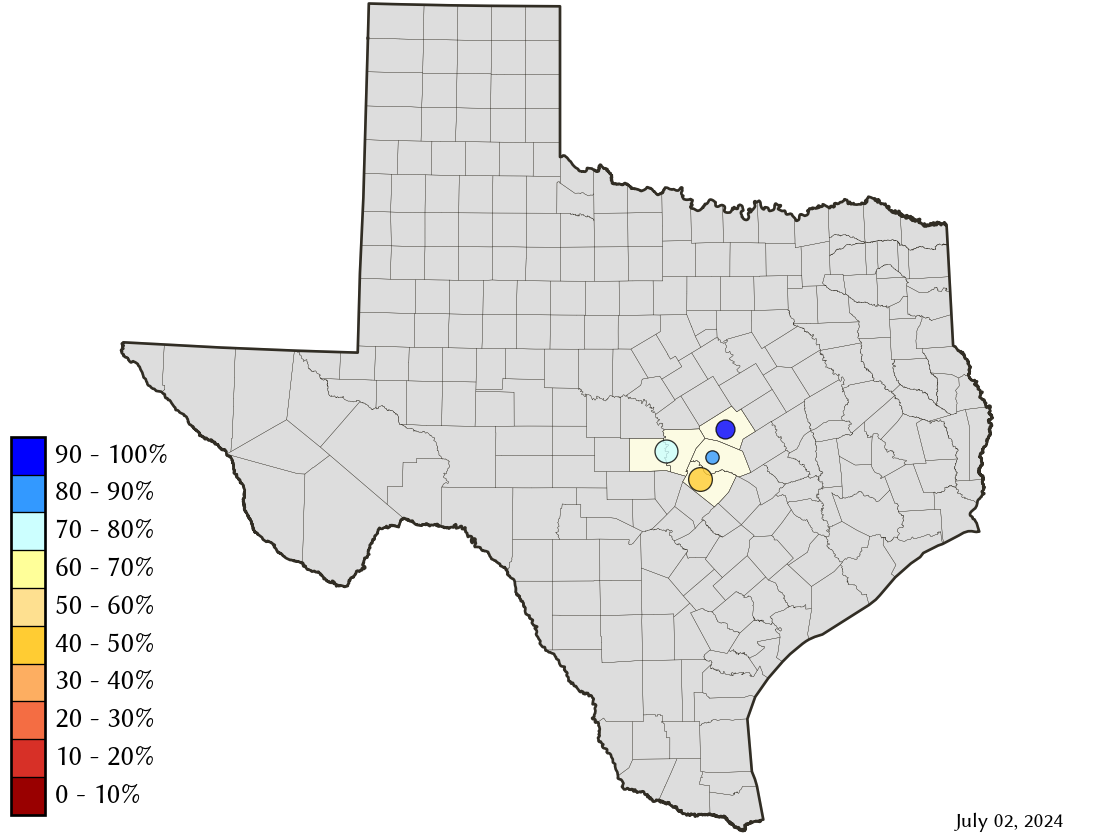
Area Map
Reservoir Storage
| Reservoir | Percent Full |
Water Level (ft) |
Height Above Conservation Pool (ft) |
Reservoir Storage (acre-ft) |
Conservation Storage (acre-ft) |
Conservation Capacity (acre-ft) |
Surface Area (acres) |
|---|---|---|---|---|---|---|---|
| Buchanan | 58.6 | 1,001.94 | -18.06 | 521,238 | 507,576 | 866,694 | 16,528 |
| Georgetown | 66.8 | 780.14 | -10.86 | 25,435 | 25,372 | 38,005 | 1,021 |
| Stillhouse Hollow | 91.8 | 618.96 | -3.04 | 210,974 | 210,888 | 229,796 | 6,012 |
| Travis | 43.5 | 637.53 | -43.47 | 494,614 | 477,582 | 1,098,044 | 10,253 |