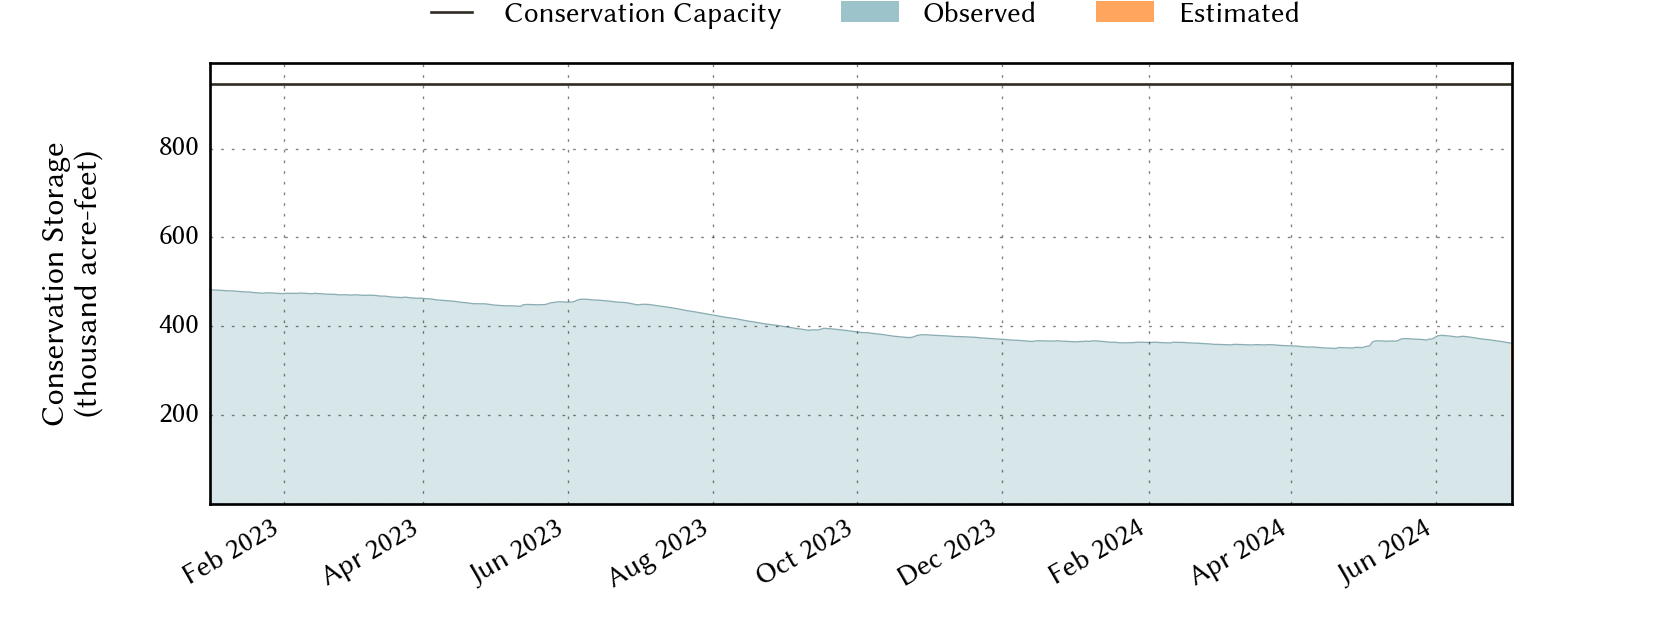
Abilene Area Reservoirs: Monitored Water Supply Reservoirs are 43.3% full on 2025-02-23
Historical Data
| Date | Percent Full |
Reservoir Storage (acre-ft) |
Conservation Storage (acre-ft) |
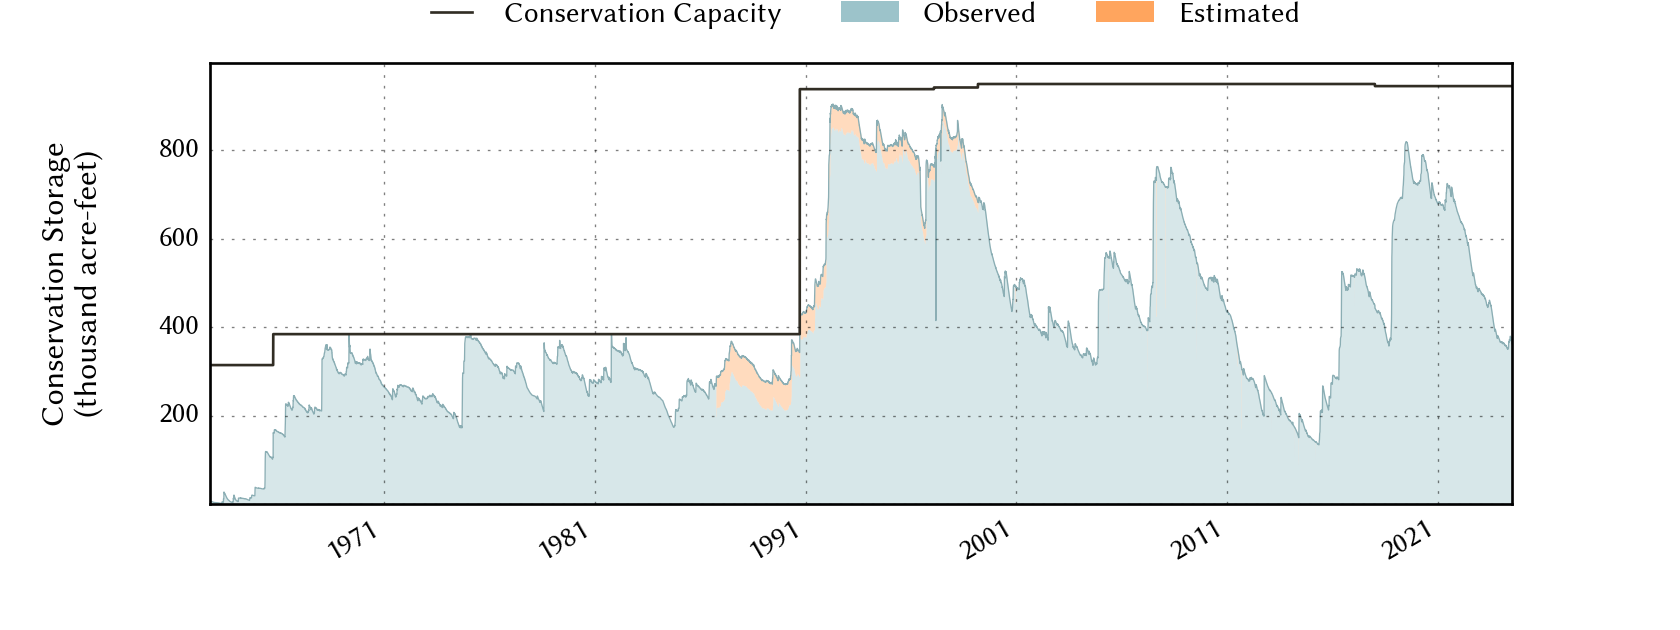
Conservation Capacity (acre-ft) |
|
|---|---|---|---|---|---|
| Today | 2025-02-23 | 43.3 | 414,661 | 409,779 | 945,568 |
| Yesterday | 2025-02-22 | 43.3 | 414,661 | 409,779 | 945,568 |
| 2 days ago | 2025-02-21 | 43.3 | 414,662 | 409,780 | 945,568 |
| 1 week ago | 2025-02-16 | 43.5 | 416,628 | 411,746 | 945,568 |
| 1 month ago | 2025-01-23 | 43.7 | 418,125 | 413,243 | 945,568 |
| 3 months ago | 2024-11-23 | 45.2 | 432,506 | 427,624 | 945,568 |
| 6 months ago | 2024-08-23 | 34.6 | 332,036 | 327,154 | 945,568 |
| 1 year ago | 2024-02-23 | 38.2 | 366,253 | 361,371 | 945,568 |
*
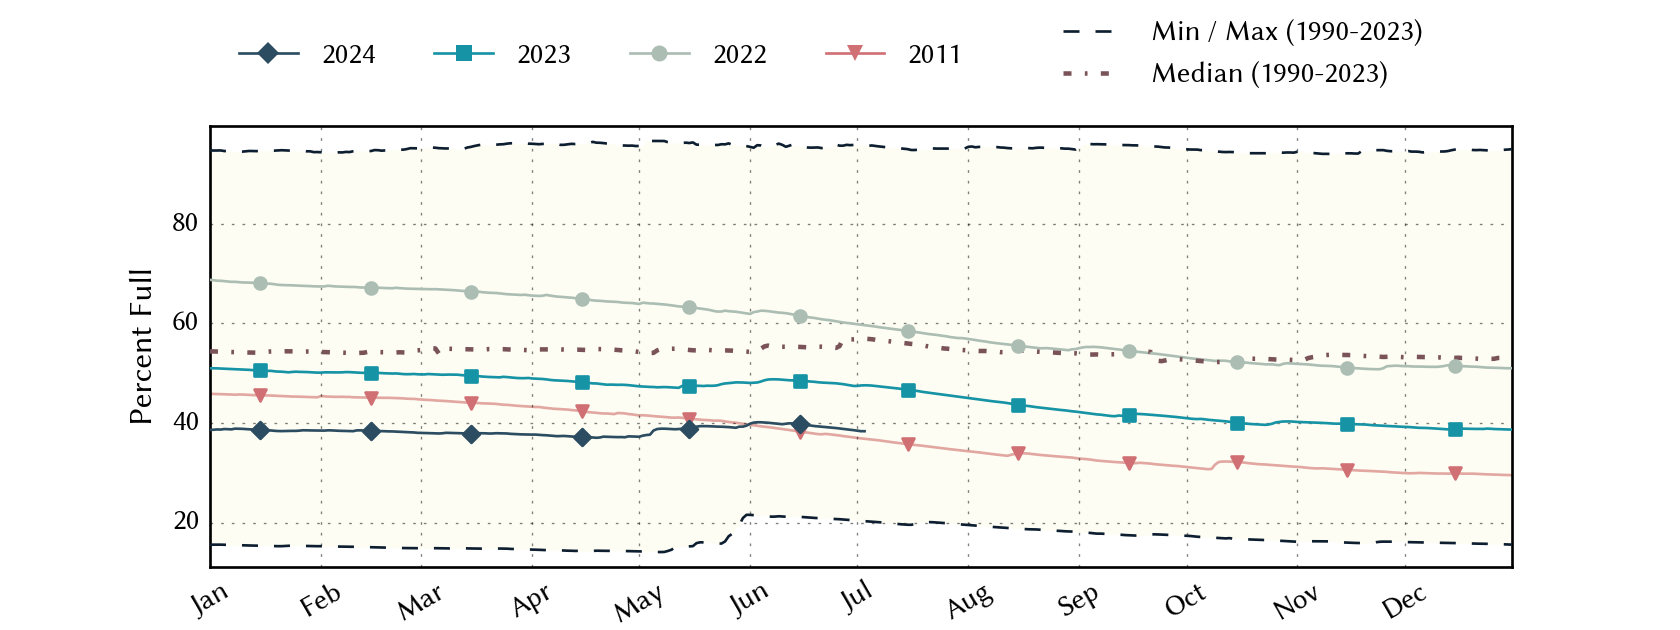
Percent Full is based on Conservation Storage and Conservation Capacity and doesn't account for storage in flood pool.
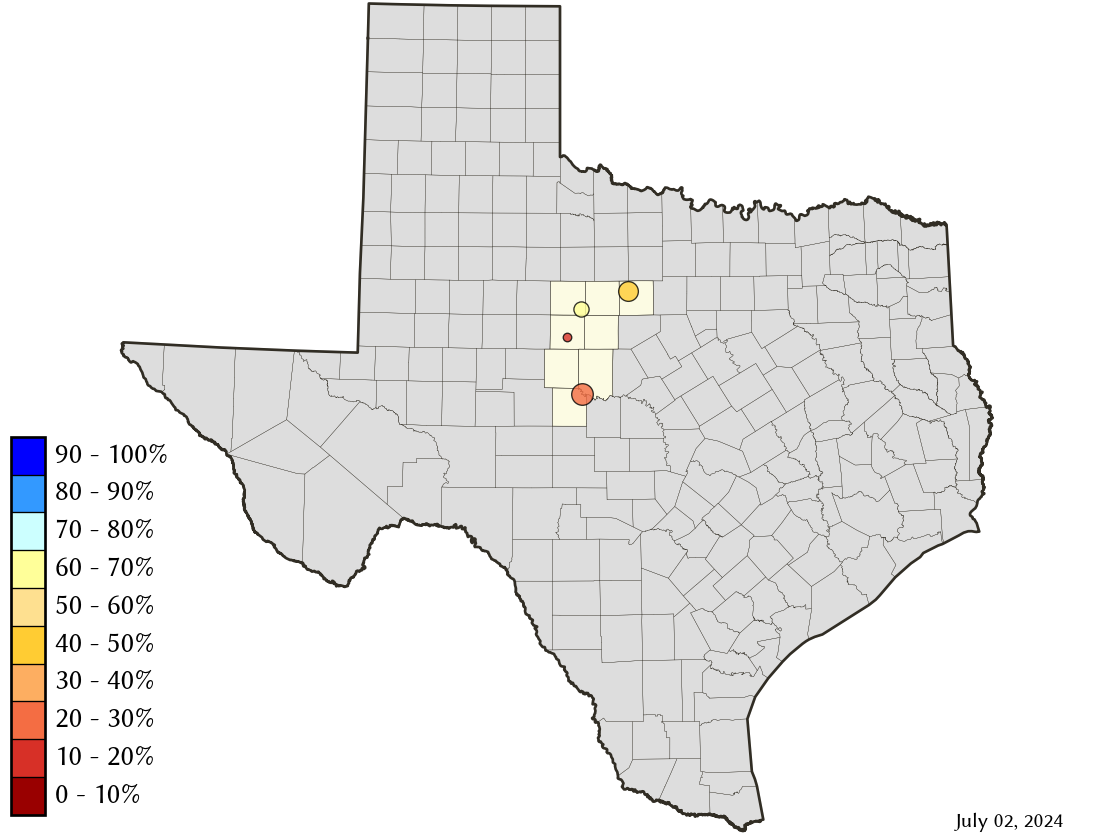
Area Map
Reservoir Storage
| Reservoir | Percent Full |
Water Level (ft) |
Height Above Conservation Pool (ft) |
Reservoir Storage (acre-ft) |
Conservation Storage (acre-ft) |
Conservation Capacity (acre-ft) |
Surface Area (acres) |
|---|---|---|---|---|---|---|---|
| Abilene | 5.1 | 1,989.66 | -22.64 | 399 | 399 | 7,900 | 109 |
| Fort Phantom Hill | 64.6 | 1,628.56 | -7.34 | 45,245 | 45,239 | 70,030 | 2,926 |
| Hubbard Creek | 46.1 | 1,169.73 | -13.58 | 149,267 | 144,391 | 313,298 | 9,440 |
| O H Ivie | 39.6 | 1,528.36 | -23.14 | 219,750 | 219,750 | 554,340 | - n.a. - |