Reservoir Storage Summary for Climate Divisions on 2025-02-23
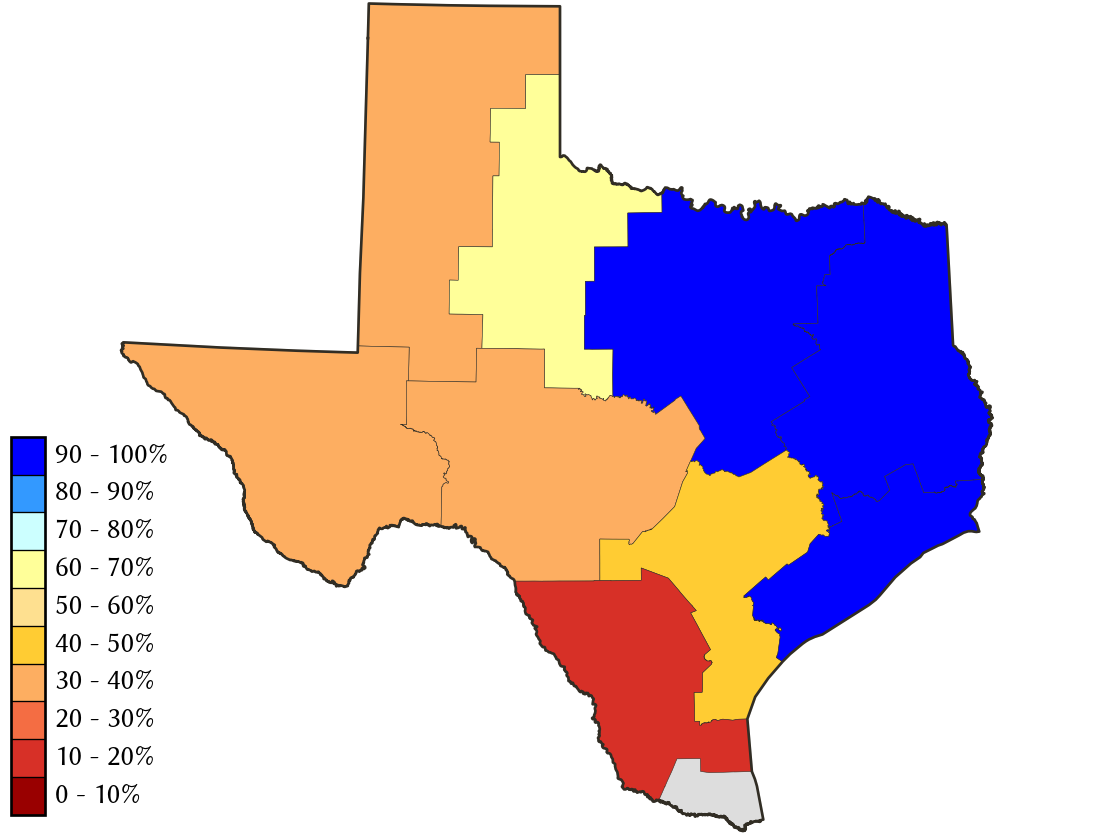
Percent Full
| Today | Yesterday | 2 days ago | 1 week ago | 1 month ago | 3 months ago | 6 months ago | 1 year ago | |
|---|---|---|---|---|---|---|---|---|
| 2025-02-23 | 2025-02-22 | 2025-02-21 | 2025-02-16 | 2025-01-23 | 2024-11-23 | 2024-08-23 | 2024-02-23 | |
| East Texas | 99.3 | 99.2 | 99.3 | 99.2 | 95.6 | 90.3 | 95.9 | 98.2 |
| Edwards Plateau | 34.5 | 34.5 | 34.5 | 34.8 | 35.0 | 36.3 | 33.7 | 30.4 |
| High Plains | 33.5 | 33.5 | 33.5 | 33.6 | 33.6 | 33.5 | 33.6 | 37.1 |
| Low Rolling Plains | 69.9 | 70.0 | 70.0 | 70.2 | 70.7 | 72.1 | 62.8 | 53.4 |
| North Central | 92.7 | 92.7 | 92.8 | 93.2 | 90.1 | 89.5 | 92.7 | 90.2 |
| South | 16.6 | 16.7 | 16.7 | 16.4 | 16.4 | 15.9 | 16.8 | 22.0 |
| South Central | 43.7 | 43.8 | 43.7 | 43.8 | 43.7 | 44.7 | 48.4 | 44.6 |
| Trans Pecos | 38.5 | 38.5 | 38.4 | 38.4 | 37.6 | 35.5 | 33.8 | 37.3 |
| Upper Coast | 79.6 | 79.3 | 78.5 | 83.7 | 84.5 | 84.1 | 97.6 | 100.0 |
*
Percent Full is based on Conservation Storage and Conservation Capacity.
Recent Conditions
| Percent Full |
Reservoir Storage (acre-ft) |
Conservation Storage (acre-ft) |
Conservation Capacity (acre-ft) |
|
|---|---|---|---|---|
| East Texas | 99.3 | 12,706,467 | 9,815,145 | 9,886,943 |
| Edwards Plateau | 34.5 | 1,706,079 | 1,472,104 | 4,261,647 |
| High Plains | 33.5 | 253,911 | 213,531 | 637,396 |
| Low Rolling Plains | 69.9 | 640,420 | 632,180 | 903,870 |
| North Central | 92.7 | 11,471,300 | 10,185,865 | 10,984,350 |
| South | 16.6 | 489,217 | 412,790 | 2,481,249 |
| South Central | 43.7 | 865,103 | 847,391 | 1,936,953 |
| Trans Pecos | 38.5 | 58,172 | 58,172 | 151,110 |
| Upper Coast | 79.6 | 240,847 | 231,833 | 291,293 |
**
The Lower Valley climate division has no contributing Reservoirs present.