Region-B Planning Region Reservoirs: Monitored Water Supply Reservoirs are 81.2% full on 2025-02-23
Historical Data
| Date | Percent Full |
Reservoir Storage (acre-ft) |
Conservation Storage (acre-ft) |
Conservation Capacity (acre-ft) |
|
|---|---|---|---|---|---|
| Today | 2025-02-23 | 81.2 | 508,930 | 501,669 | 618,121 |
| Yesterday | 2025-02-22 | 81.2 | 509,137 | 501,876 | 618,121 |
| 2 days ago | 2025-02-21 | 81.2 | 508,899 | 501,623 | 618,121 |
| 1 week ago | 2025-02-16 | 81.3 | 510,993 | 502,833 | 618,121 |
| 1 month ago | 2025-01-23 | 81.7 | 514,183 | 505,123 | 618,121 |
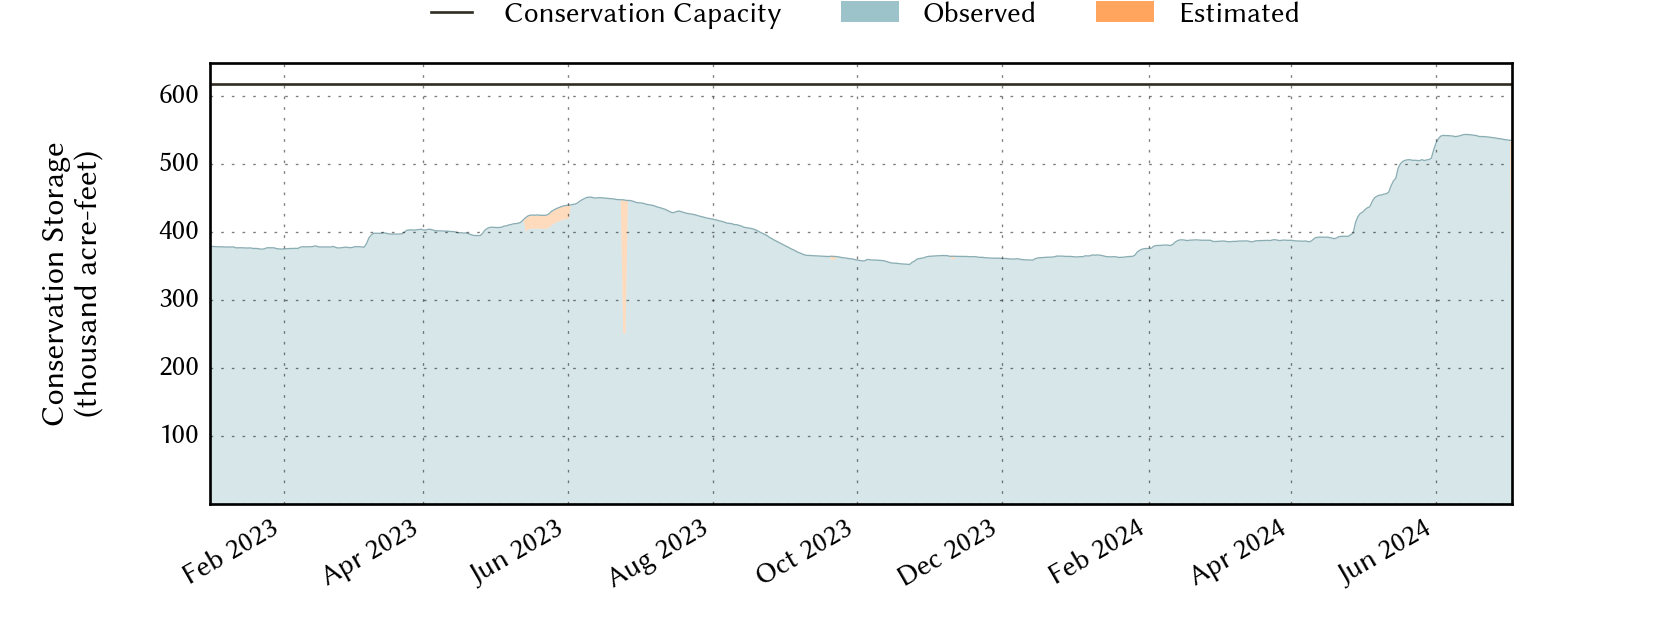
| 3 months ago | 2024-11-23 | 83.1 | 524,851 | 513,683 | 618,121 |
| 6 months ago | 2024-08-23 | 82.6 | 537,983 | 510,853 | 618,121 |
| 1 year ago | 2024-02-23 | 62.8 | 389,368 | 388,154 | 618,121 |
*
Percent Full is based on Conservation Storage and Conservation Capacity and doesn't account for storage in flood pool.
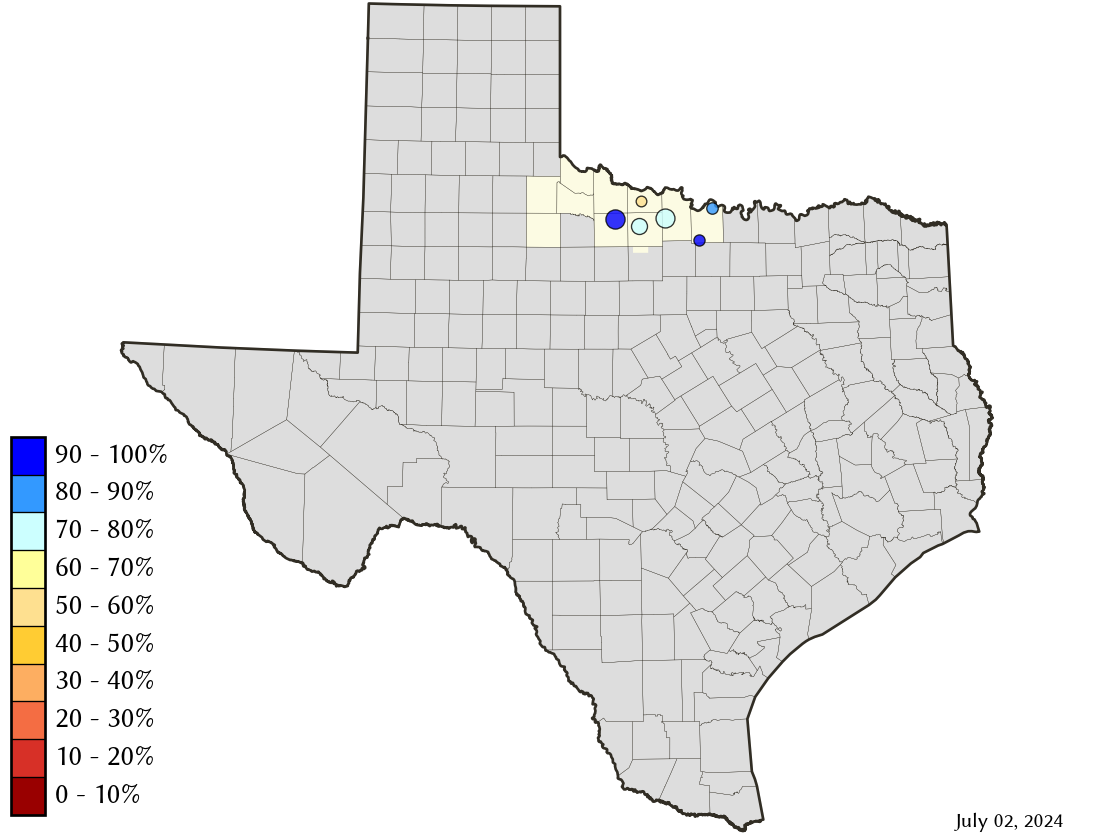
Area Map
Reservoir Storage
| Reservoir | Percent Full |
Water Level (ft) |
Height Above Conservation Pool (ft) |
Reservoir Storage (acre-ft) |
Conservation Storage (acre-ft) |
Conservation Capacity (acre-ft) |
Surface Area (acres) |
|---|---|---|---|---|---|---|---|
| Amon G Carter | 100.0 | 920.22 | 0.22 | 20,401 | 19,266 | 19,266 | 1,504 |
| Arrowhead | 67.3 | 920.21 | -5.79 | 155,016 | 155,016 | 230,359 | 11,520 |
| Kemp | 100.0 | 1,144.37 | 0.37 | 251,129 | 245,307 | 245,307 | - n.a. - |
| Kickapoo | 66.8 | 1,039.53 | -5.47 | 57,670 | 57,670 | 86,345 | 4,621 |
| Nocona | 86.6 | 825.29 | -2.21 | 18,874 | 18,570 | 21,444 | 1,261 |
| North Fork Buffalo Creek | 37.9 | 1,040.26 | -7.74 | 5,840 | 5,840 | 15,400 | 788 |