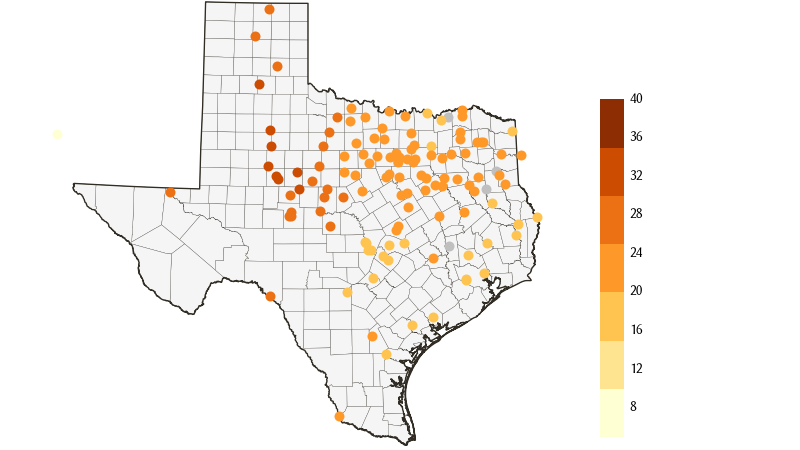
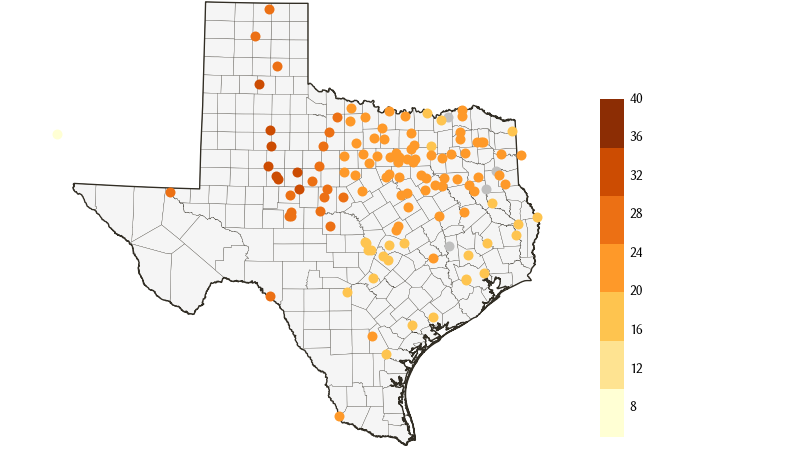
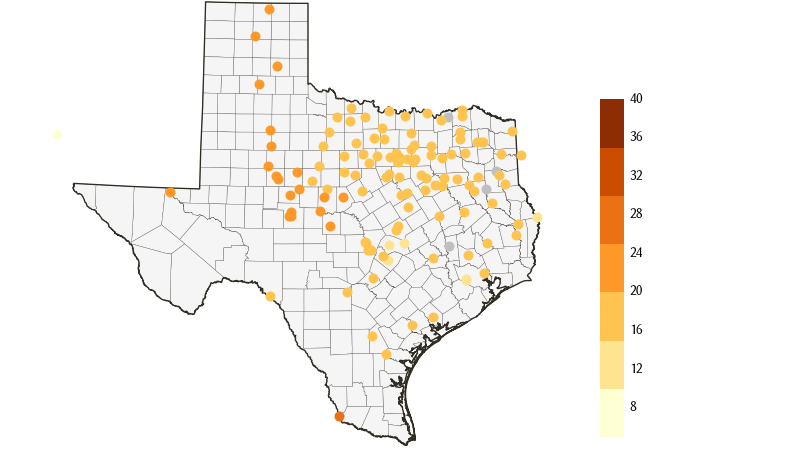
Forecast of Total May–July 2025 Reservoir Evaporation
Issued On 2025-02-17
- The Texas Water Development Board is providing experimental forecasts of May‒July reservoir evaporation using a similar statistical forecast technique to that which it used for the generation of May‒July rainfall forecasts.
- These forecasts are being issued from January through end-April. The forecasts are updated every two weeks.
- The forecasts from January through March are based on predicted values of April atmospheric circulation patterns and soil moisture over Texas known to influence May‒July rainfall and, by assumption, reservoir evaporation over the same period. The predictions are obtained from the Climate Forecast System version 2 (CFSv2, Saha et al., 2014), which is the operational dynamical seasonal forecast model of the National Oceanic and Atmospheric Administration-National Centers for Environmental Prediction.
- The forecast issued at the beginning of May is based on observed atmospheric circulation patterns and soil moisture over Texas known to influence May‒July rainfall and, by assumption, reservoir evaporation. Observations of April atmospheric circulation patterns and soil moisture over Texas are obtained from the Climate Forecast System Reanalysis dataset ( Saha et al., 2010).
- The forecast maps provide deterministic forecasts (i.e. quantitative estimates) of cumulative reservoir evaporation over the May‒July season over each major reservoir (i.e. reservoirs with capacity greater than 5000 acre-feet) in Texas. Hovering over a reservoir opens up a popup, which provides the reservoir evaporation value over the selected reservoir.
- Lighter colors (e.g. yellow) indicate lower values of reservoir evaporation (typically associated with wet conditions) and deeper colors (e.g. red to brown) indicate higher values of reservoir evaporation (typically associated with dry conditions).
- A Texas Water Development Board technical note providing further details on the evaporation forecast tool is currently under development and will be available at this site shortly.
If you have questions or need further information, please contact us.
Disclaimer
The May‒July seasonal reservoir evaporation forecast is an experimental forecast. It is primarily meant to be an information source to aid the implementation of drought contingency and emergency management plans. The TWDB provides information via this web site as a public service. Neither the State of Texas nor the TWDB assumes any legal liability or responsibility or makes any guarantees or warranties as to the accuracy, completeness, or suitability of the information for any particular purpose.
Acknowledgements
The provision of these rainfall and reservoir evaporation forecasts via this website was made possible through the U.S. Bureau of Reclamation WaterSMART Drought Resiliency funding to the Texas Water Development Board (Grant: R15AP00184; Fiscal Year: 2015).
Mid-January (6.5-month lead forecast)

End-January (6.0-month lead forecast)

Mid-February (5.5-month lead forecast)
